Montag, 10. März 2014

Capturing SNMP Values During Load Tests

After capturing and analyzing response times I need some monitoring data to correlate the results to. As far as I could find out, JMeter does not provide means to capture system attributes like CPU, memory, and I/O utilization. So I set off to build something on my own. My application servers run a SNMP daemon. It seemed to obvious to query system data via the available service.

Preparation

In order to query SNMP data I had to install some Debian packages:
/install-packages.sh
sudo apt-get install \
  snmp \
  snmp-mibs-downloader
The snmp package provides the required command line tools, especially snmpget and snmpwalk. snmp-mibs-downloader provides Management Information Base files in the directory /usr/share/snmp/mibs SNMP data structures.
SNMP structures the management information in a numerical, hierarchical format that is very hard to reason about:
/snmpwalk.sh
snmpwalk -v2c -c public 10.0.0.3
iso.3.6.1.2.1.1.1.0 = STRING: "Linux bay5 3.2.0-59-generic #90-Ubuntu SMP Tue Jan 7 22:43:51 UTC 2014 x86_64"
iso.3.6.1.2.1.1.2.0 = OID: iso.3.6.1.4.1.8072.3.2.10
iso.3.6.1.2.1.1.3.0 = Timeticks: (145234) 0:24:12.34
iso.3.6.1.2.1.1.4.0 = STRING: "Root <root@localhost>"
iso.3.6.1.2.1.1.5.0 = STRING: "bay5"
iso.3.6.1.2.1.1.6.0 = STRING: "Server Room"
iso.3.6.1.2.1.1.8.0 = Timeticks: (0) 0:00:00.00
iso.3.6.1.2.1.1.9.1.2.1 = OID: iso.3.6.1.6.3.10.3.1.1
iso.3.6.1.2.1.1.9.1.2.2 = OID: iso.3.6.1.6.3.11.3.1.1
iso.3.6.1.2.1.1.9.1.2.3 = OID: iso.3.6.1.6.3.15.2.1.1
iso.3.6.1.2.1.1.9.1.2.4 = OID: iso.3.6.1.6.3.1
iso.3.6.1.2.1.1.9.1.2.5 = OID: iso.3.6.1.2.1.49
iso.3.6.1.2.1.1.9.1.2.6 = OID: iso.3.6.1.2.1.4
iso.3.6.1.2.1.1.9.1.2.7 = OID: iso.3.6.1.2.1.50
iso.3.6.1.2.1.1.9.1.2.8 = OID: iso.3.6.1.6.3.16.2.2.1
iso.3.6.1.2.1.1.9.1.3.1 = STRING: "The SNMP Management Architecture MIB."
iso.3.6.1.2.1.1.9.1.3.2 = STRING: "The MIB for Message Processing and Dispatching."
iso.3.6.1.2.1.1.9.1.3.3 = STRING: "The management information definitions for the SNMP User-based Security Model."
iso.3.6.1.2.1.1.9.1.3.4 = STRING: "The MIB module for SNMPv2 entities"
iso.3.6.1.2.1.1.9.1.3.5 = STRING: "The MIB module for managing TCP implementations"
iso.3.6.1.2.1.1.9.1.3.6 = STRING: "The MIB module for managing IP and ICMP implementations"
iso.3.6.1.2.1.1.9.1.3.7 = STRING: "The MIB module for managing UDP implementations"
iso.3.6.1.2.1.1.9.1.3.8 = STRING: "View-based Access Control Model for SNMP."
# ~2300 more entries
The Management Information Base provides metadata that provide human-readable names and categories. To activate MIBs I have to set the MIBS environment variable:
/capture-snmp.sh
export MIBS=ALL
Afterwords, the output is easier to understand:
/snmpwalk-mibs.sh
$ snmpwalk -v2c -c public 10.0.0.3
SNMPv2-MIB::sysDescr.0 = STRING: Linux bay5 3.2.0-59-generic #90-Ubuntu SMP Tue Jan 7 22:43:51 UTC 2014 x86_64
SNMPv2-MIB::sysObjectID.0 = OID: NET-SNMP-TC::linux
DISMAN-EVENT-MIB::sysUpTimeInstance = Timeticks: (201014) 0:33:30.14
SNMPv2-MIB::sysContact.0 = STRING: Root <root@localhost>
SNMPv2-MIB::sysName.0 = STRING: bay5
SNMPv2-MIB::sysLocation.0 = STRING: Server Room
SNMPv2-MIB::sysORLastChange.0 = Timeticks: (0) 0:00:00.00
SNMPv2-MIB::sysORID.1 = OID: SNMP-FRAMEWORK-MIB::snmpFrameworkMIBCompliance
SNMPv2-MIB::sysORID.2 = OID: SNMP-MPD-MIB::snmpMPDCompliance
SNMPv2-MIB::sysORID.3 = OID: SNMP-USER-BASED-SM-MIB::usmMIBCompliance
SNMPv2-MIB::sysORID.4 = OID: SNMPv2-MIB::snmpMIB
SNMPv2-MIB::sysORID.5 = OID: TCP-MIB::tcpMIB
SNMPv2-MIB::sysORID.6 = OID: RFC1213-MIB::ip
SNMPv2-MIB::sysORID.7 = OID: UDP-MIB::udpMIB
SNMPv2-MIB::sysORID.8 = OID: SNMP-VIEW-BASED-ACM-MIB::vacmBasicGroup
SNMPv2-MIB::sysORDescr.1 = STRING: The SNMP Management Architecture MIB.
SNMPv2-MIB::sysORDescr.2 = STRING: The MIB for Message Processing and Dispatching.
SNMPv2-MIB::sysORDescr.3 = STRING: The management information definitions for the SNMP User-based Security Model.
SNMPv2-MIB::sysORDescr.4 = STRING: The MIB module for SNMPv2 entities
SNMPv2-MIB::sysORDescr.5 = STRING: The MIB module for managing TCP implementations
SNMPv2-MIB::sysORDescr.6 = STRING: The MIB module for managing IP and ICMP implementations
SNMPv2-MIB::sysORDescr.7 = STRING: The MIB module for managing UDP implementations
SNMPv2-MIB::sysORDescr.8 = STRING: View-based Access Control Model for SNMP.
# ~2300 more entries
In addition, there are categories of values that can be queried, e.g. systemStats or memory:
/capture-snmp.sh
snmpwalk -v2c -c public 10.0.0.3 systemStats > 10.0.0.3.systemStats.snmpwalk
snmpwalk -v2c -c public 10.0.0.3 memory      > 10.0.0.3.memory.snmpwalk
/10.0.0.3.systemStats.snmpwalk
UCD-SNMP-MIB::ssIndex.0 = INTEGER: 1
UCD-SNMP-MIB::ssErrorName.0 = STRING: systemStats
UCD-SNMP-MIB::ssSwapIn.0 = INTEGER: 0 kB
UCD-SNMP-MIB::ssSwapOut.0 = INTEGER: 0 kB
UCD-SNMP-MIB::ssIOSent.0 = INTEGER: 6 blocks/s
UCD-SNMP-MIB::ssIOReceive.0 = INTEGER: 0 blocks/s
UCD-SNMP-MIB::ssSysInterrupts.0 = INTEGER: 62 interrupts/s
UCD-SNMP-MIB::ssSysContext.0 = INTEGER: 124 switches/s
UCD-SNMP-MIB::ssCpuUser.0 = INTEGER: 1
UCD-SNMP-MIB::ssCpuSystem.0 = INTEGER: 0
UCD-SNMP-MIB::ssCpuIdle.0 = INTEGER: 97
UCD-SNMP-MIB::ssCpuRawUser.0 = Counter32: 3112
UCD-SNMP-MIB::ssCpuRawNice.0 = Counter32: 0
UCD-SNMP-MIB::ssCpuRawSystem.0 = Counter32: 366
UCD-SNMP-MIB::ssCpuRawIdle.0 = Counter32: 16735
UCD-SNMP-MIB::ssCpuRawWait.0 = Counter32: 96
UCD-SNMP-MIB::ssCpuRawKernel.0 = Counter32: 0
UCD-SNMP-MIB::ssCpuRawInterrupt.0 = Counter32: 33
UCD-SNMP-MIB::ssIORawSent.0 = Counter32: 5482
UCD-SNMP-MIB::ssIORawReceived.0 = Counter32: 203276
UCD-SNMP-MIB::ssRawInterrupts.0 = Counter32: 31382
UCD-SNMP-MIB::ssRawContexts.0 = Counter32: 68221
UCD-SNMP-MIB::ssCpuRawSoftIRQ.0 = Counter32: 13
UCD-SNMP-MIB::ssRawSwapIn.0 = Counter32: 0
UCD-SNMP-MIB::ssRawSwapOut.0 = Counter32: 0
/10.0.0.3.memory.snmpwalk
UCD-SNMP-MIB::memIndex.0 = INTEGER: 0
UCD-SNMP-MIB::memErrorName.0 = STRING: swap
UCD-SNMP-MIB::memTotalSwap.0 = INTEGER: 466936 kB
UCD-SNMP-MIB::memAvailSwap.0 = INTEGER: 466936 kB
UCD-SNMP-MIB::memTotalReal.0 = INTEGER: 1026948 kB
UCD-SNMP-MIB::memAvailReal.0 = INTEGER: 632672 kB
UCD-SNMP-MIB::memTotalFree.0 = INTEGER: 1099608 kB
UCD-SNMP-MIB::memMinimumSwap.0 = INTEGER: 16000 kB
UCD-SNMP-MIB::memBuffer.0 = INTEGER: 4116 kB
UCD-SNMP-MIB::memCached.0 = INTEGER: 97152 kB
UCD-SNMP-MIB::memSwapError.0 = INTEGER: noError(0)
UCD-SNMP-MIB::memSwapErrorMsg.0 = STRING: 

Capturing Data Regularly

As a first step, I was fine with just capturing CPU and memory statistics. Selectively querying this information was quite valueable, because a full snmpwalk turned out to be too expensive and influenced the test results. I wrote a small script to record systemStats and memory every 60 seconds:
/capture-snmp-regularly.sh
host=$1
interval=${2:-60}

export MIBS=ALL
while true; do
  timestamp=$(date +%s%N | cut -b1-13)
  record_dir="$host/$timestamp"
  echo "Recording SNMP indicators to $record_dir/"
  mkdir --parents "$record_dir"
  snmpwalk -t 1 -v2c -c public $host systemStats > $record_dir/$host.systemStats.snmpwalk
  snmpwalk -t 1 -v2c -c public $host memory      > $record_dir/$host.memory.snmpwalk
  sleep $interval
done
The results are organized hierarchical in directories by host and the timestamp.

Cleaning Up and Collecting the Captured Data

To prepare the data for analysis with R, I stripped out some uninteresting tokens:
/cleanup-snmp-data.sh
#!/bin/bash
cat - | \
  sed "s/UCD-SNMP-MIB:://" | \
  sed "s/INTEGER: //" | \
  sed "s/STRING: //" | \
  sed "s/Counter32: //" | \
  sed "s/\.0//" | \
  sed "s/ = /,/g"
Afterwards I wrote a script to traverse the directories, read the snmpwalk data, clean it up and prepending the host name and timestamp.
/collect-snmp-data.sh
#!/bin/bash
for recording in $( ls --directory */*/ ); do
  host=$( echo "$recording" | sed 's/\([0-9]\+\.[0-9]\+\.[0-9]\+\.[0-9]\+\)\/\([0-9]\+\)\//\1/' )
  timestamp=$( echo "$recording" | sed 's/\([0-9]\+\.[0-9]\+\.[0-9]\+\.[0-9]\+\)\/\([0-9]\+\)\//\2/' )
  cat $host/$timestamp/*.snmpwalk | ./cleanup-snmp-data.sh | sed "s/^/$host,$timestamp,/"
done 
Executing ./collect-snmp-data > snmp.csv produces a neat CSV file, ready for R.

Plotting the Data

Finally, I plotted the data with R.
/snmp.R
snmps<-read.table("snmp.csv",
                  header=FALSE,
                  col.names=c('host','timestamp','valueType','value'),
                  colClasses=c('factor','numeric','factor','character'),
                  sep=","
)
ssCpuUser<-snmps[ snmps$valueType == 'ssCpuUser', ]
plot((ssCpuUser$timestamp-min(ssCpuUser$timestamp))/1000/60,
     ssCpuUser$value,
     type='o',
     main=expression(bold(paste(ssCpuUser, ", ", 1-textstyle(frac(memAvailReal, memTotalReal))))),
     xlab="Test time [min]",
     ylab="Utilization [%]",
     ylim=c(0,100),
     col="purple",
     pch=18
)

timestamps<-snmps[ snmps$valueType == 'memTotalReal', ]$timestamp
memTotalReal<-as.numeric(sub("([0-9]+) kB", "\\1", snmps[ snmps$valueType == 'memTotalReal', ]$value))
memAvailReal<-as.numeric(sub("([0-9]+) kB", "\\1", snmps[ snmps$valueType == 'memAvailReal', ]$value))
reservedMem<-1-memAvailReal/memTotalReal

lines((timestamps-min(timestamps))/1000/60,
      reservedMem*100,
      type='o',
      ylim=c(0,100),
      col="orange",
      pch=18
)
legend(0, 20,
       c("ssCpuUser", expression(1-textstyle(frac(memAvailReal, memTotalReal)))),
       col=c("purple", "orange"),
       yjust=0.5,
       pch=18
)
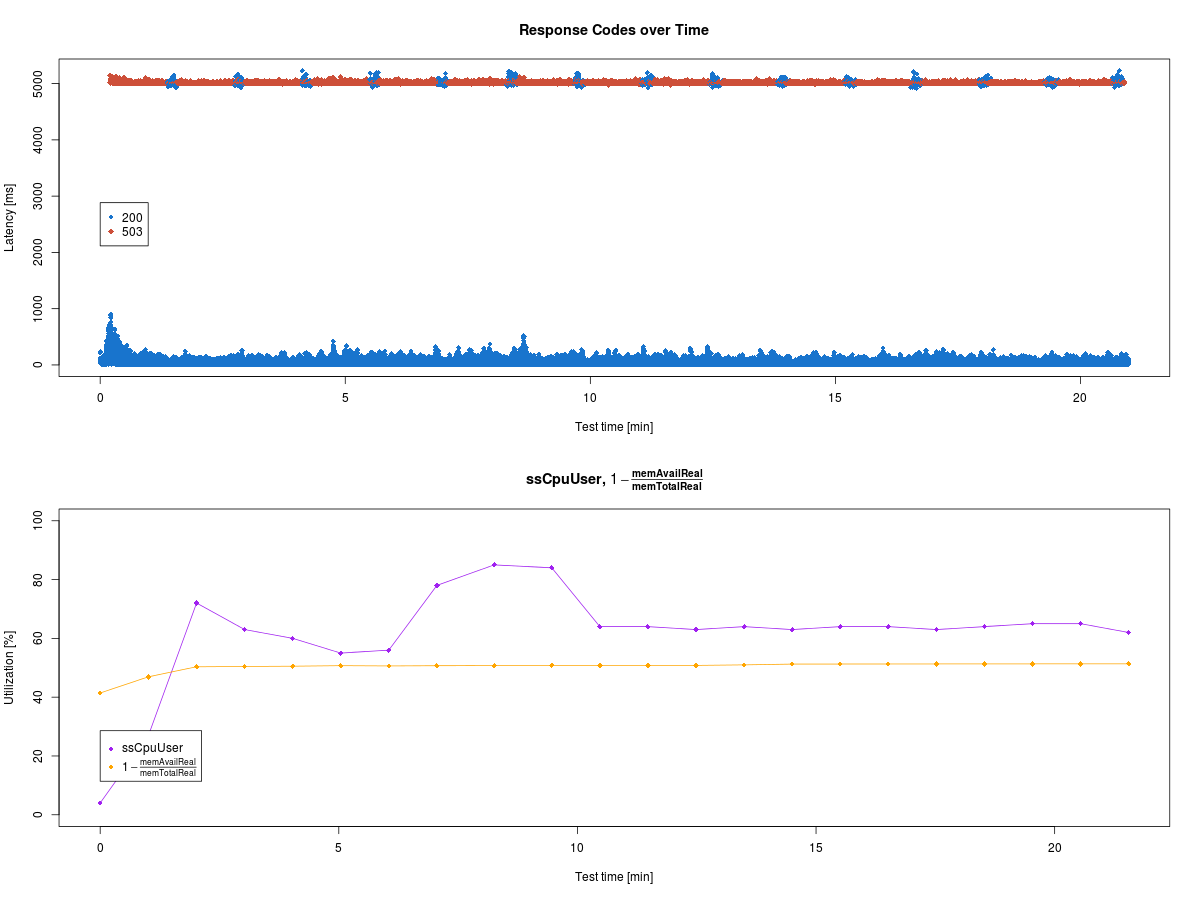
Combined with the response times from JMeter, I got the following image:

The result does not suggest any relationships between these system parameters and the response times. But that just motivates further investigation. :-) So stay tuned!
As always, the sources are available via GitHub.

References

Dienstag, 4. März 2014

Analyzing JMeter Results with R


"If you can't measure it, you can't manage it."
— Peter Drucker
To be able to improve a system's performance I need to understand the current characteristics of its operation. So I created a very simple (you might call it naïve as well) performance test with JMeter. Executing the test for roughly 35 minutes resulted in 386629 lines of raw CSV data. But raw data does not provide any insight. In order to understand what is going on I needed some statistical numbers and charts. This is where R comes into play. Reading data in is quite simple:
/response-times.R
responseTimes<-read.table("response-times.csv",header=TRUE,sep=",")
First of all, I wanted an overview of the latency over the test runtime.
/response-times.R
plot((responseTimes$timeStamp-min(responseTimes$timeStamp))/1000/60,
     responseTimes$Latency,
     xlab="Test time [min]",
     ylab="Latency [ms]",
     col="dodgerblue4",
     pch=18
)

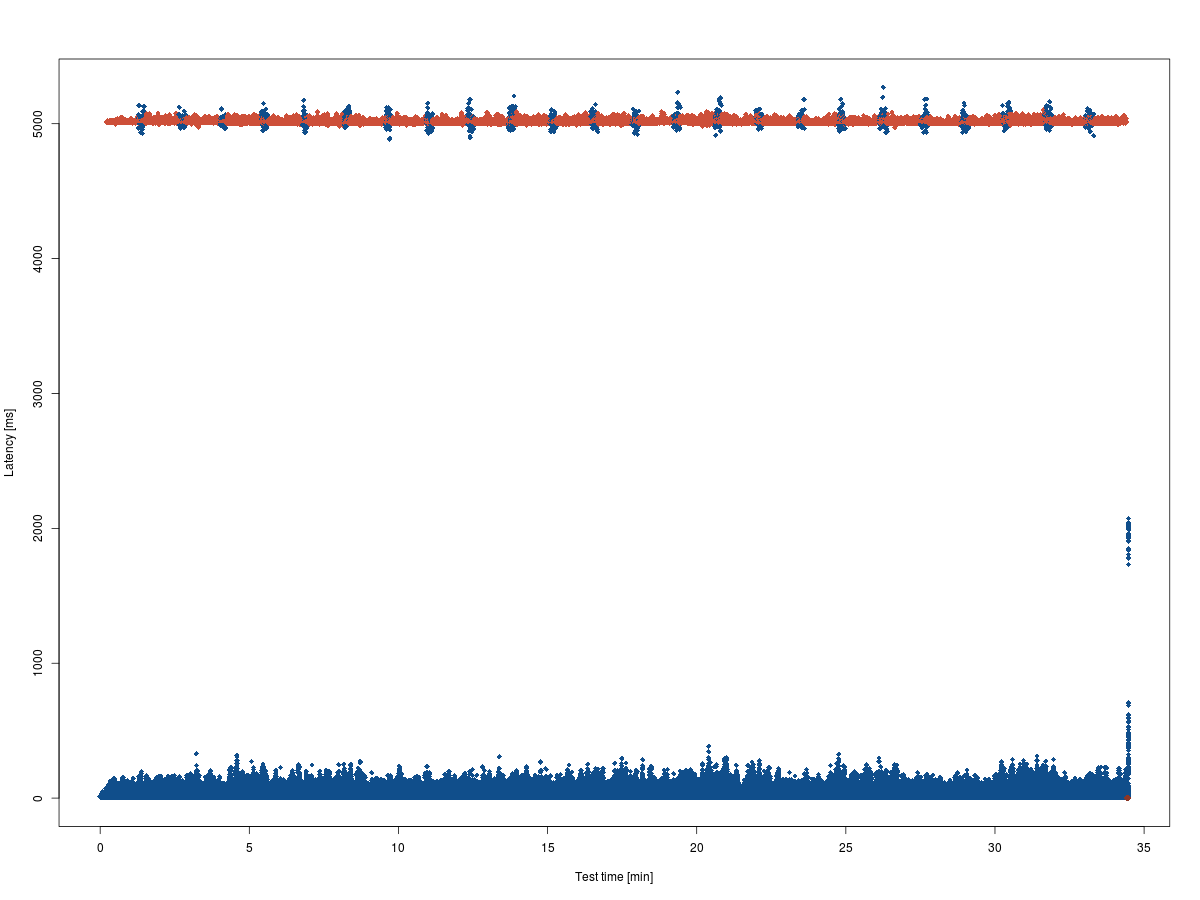
Response times seem to be pretty stable over time, I cannot identify any trends at first sight. Nevertheless, the results are split: requests are replied to either quite fast or after about 5 seconds. The "five second barrier" is interesting, though. It is too constant to be incidental. This begs for further investigation.
As a next step, I analyzed the ratios of HTTP response codes during the test:
/response-times.R
par(lwd=4)
pie(summary(responseTimes$responseCode),
    clockwise=TRUE,
    col=c("steelblue3", "tomato2", "tomato3"),
    border=c("steelblue4","tomato4","tomato4"),
    main="HTTP Response Codes"
)

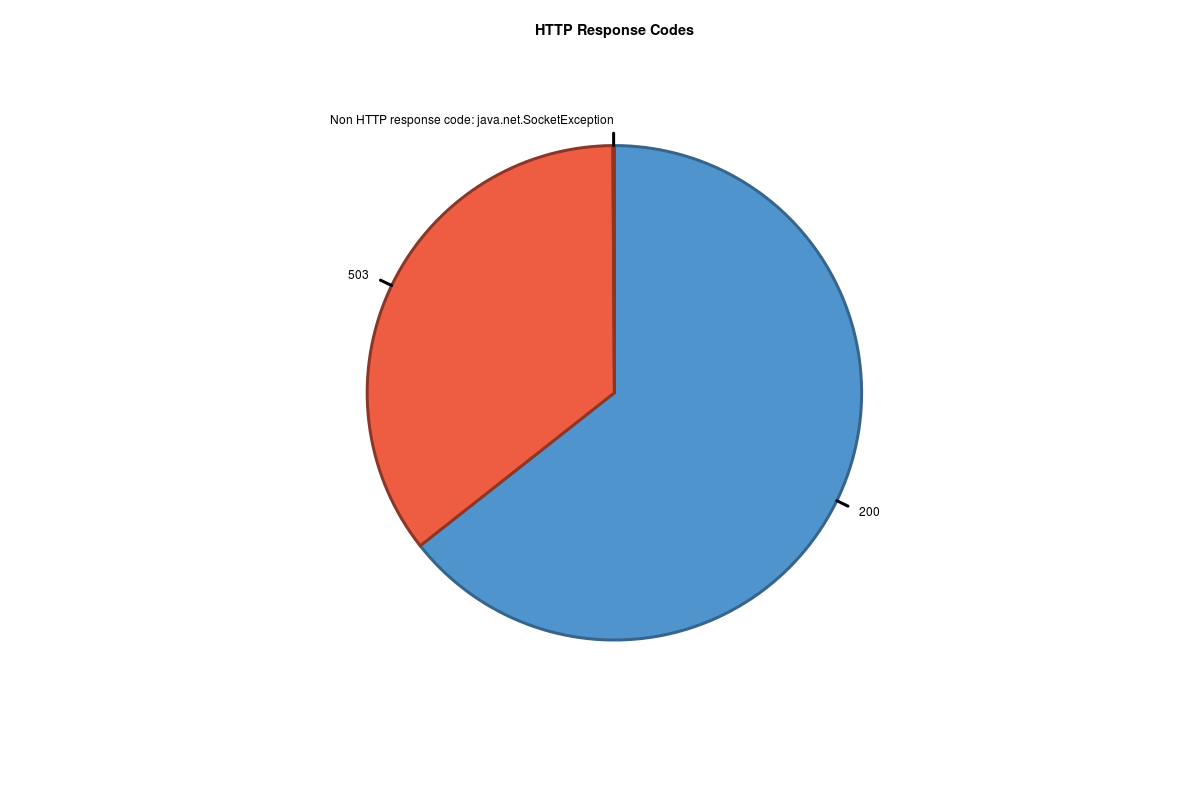
About 2/3 of the requests are handled successfully, but 1/3 of the requests resulted in server errors. That's definitely too many and needs improvements.
As a last, but very important step, I analyzed the overall service levels. So I created a plot of the cumulated relative frequency of the response times.
/response-times.R
plot(ecdf(responseTimes$Latency),
     main="Cumulative relative frequency of response times",
     xlab="Latency [ms]",
     ylab="Quantiles",
     pch=18
)
Important indicators are usability barriers and the 95 percentile. Regarding usability, the ultimate goal are 100 ms response time; this makes the system appear instantaneous. 1000 ms response time are the maximum not to interrupt the user's flow of thought.
/response-times.R
axis(1,at=c(100),labels=c("100"),col="green4")
instantResponse = cumsum(table(cut(responseTimes$Latency,c(0,100))))/nrow(responseTimes)
segments(100,-1,100,instantResponse,col="palegreen3",lty="dashed",lwd=2)
points(c(100),instantResponse,col="green4",pch=19)
text(100,instantResponse,paste(format(instantResponse*100,digits=3), "%"),col="green4",adj=c(1.1,-.3))

fastResponse = cumsum(table(cut(responseTimes$Latency,c(0,1000))))/nrow(responseTimes)
segments(1000,-1,1000,fastResponse,col="palegreen3",lty="dashed",lwd=2)
points(c(1000),fastResponse,col="green4",pch=19)
text(1000,fastResponse,paste(format(fastResponse*100,digits=3), "%"),col="green4",adj=c(1.1,-.3))
The 95 percentile is the "realistic maximum" response time. Beyond this limit are the extreme outliers that you cannot prevent on a loosely coupled, unreliable, distributed system like the internet. Fighting against these is a waste of your valuable time. But for service quality, it is important that nearly every user gets a reasonable response time. In order to calculate and plot the 95 percentile, I had to:
/response-times.R
axis(2,at=c(0,.1,.2,.3,.4,.5,.6,.7,.8,.9,.95,1),labels=FALSE)
axis(2,at=c(.95),labels=c("95%"),col="tomato3")
ninetyfiveQuantile = quantile(responseTimes$Latency,c(0.95))
segments(-10000, 0.95, ninetyfiveQuantile, .95, col="tomato1",lty="dashed",lwd=2)
points(ninetyfiveQuantile,c(0.95),col="red3",pch=19)
text(ninetyfiveQuantile,c(0.95),paste(format(ninetyfiveQuantile),"ms"),col="red3",adj=c(-.1,1.3))
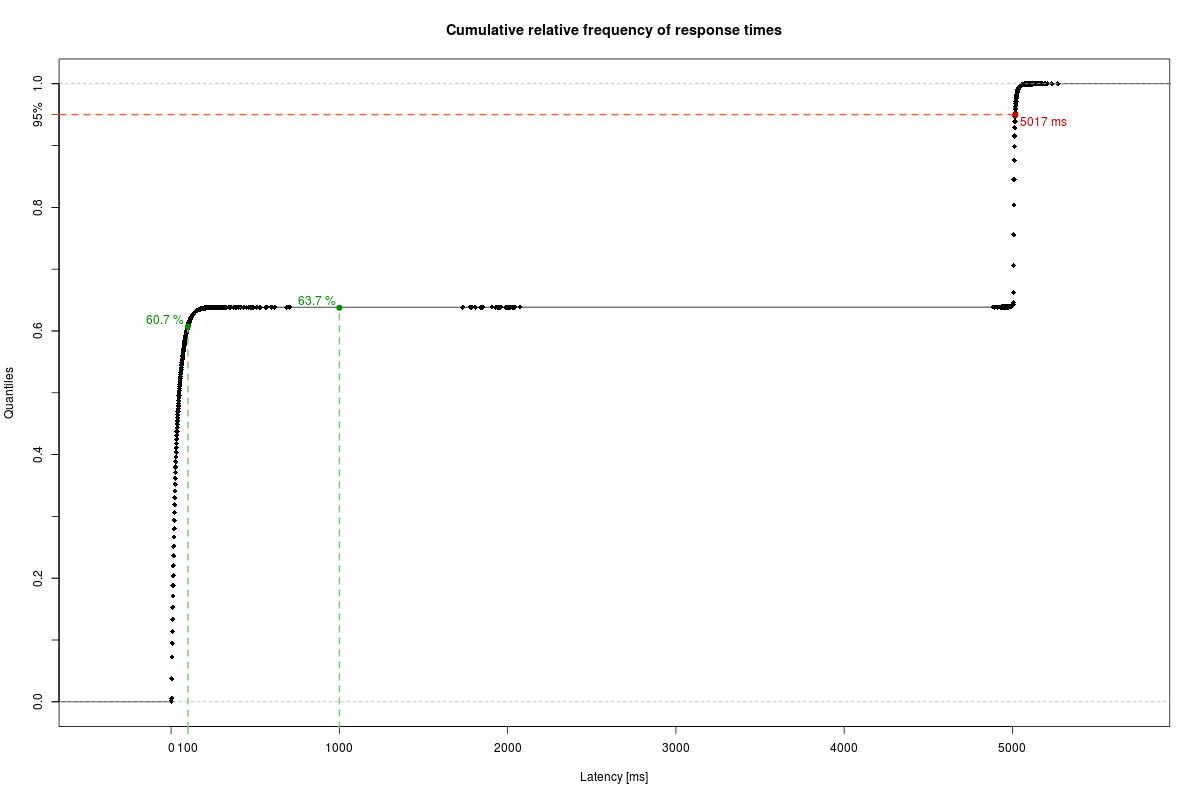
These calculations result in the following plot.

To sum it up, the system is able to
  • serve 60.7 % of its users in 100 ms or less;
  • serve 63.7 % of its users in 1000 ms or less;
  • serve 95 % of its users in 5017 ms or less.
It seems very likely that the successful requests are responded quickly, and that the responses that took about 5 seconds are the 503 errors. The timeout is probably caused by some kind of bottleneck. I did not investigate this further yet, but I am quite happy with the visualizations I produced.
As always, the sources are available via GitHub.
References:

Mittwoch, 26. Februar 2014

Setting Up Zenoss for Monitoring Grails Applications


This week I spent setting up a simple monitored set of virtualized Grails application servers. As my monitoring service I chose Zenoss.

Multi-Machine Setup with Vagrant

In order to simulate a production-like private network I created a multi-machine configuration for Vagrant comprising 3 machines:
  • 10.0.0.2 is the installation target for the Zenoss server
  • 10.0.0.3 and 10.0.0.4 are the two to-be-monitored application servers, each configured as a blue/green deployable Tomcat for hosting Grails applications

Vagrantfile
VAGRANTFILE_API_VERSION = "2"

Vagrant.configure(VAGRANTFILE_API_VERSION) do |config|
  config.vm.define "zenoss" do |zenoss_server|
    zenoss_server.vm.box = "CentOS-6.2-x86_64"
    zenoss_server.vm.box_url = "https://dl.dropboxusercontent.com/u/17905319/vagrant-boxes/CentOS-6.2-x86_64.box"

    zenoss_server.vm.network :private_network, ip: "10.0.0.2"
    # ...
  end

  (1..2).each do |idx|
    config.vm.define "grails#{idx}" do |grails_web|
      grails_web.vm.box = "squeezy"
      grails_web.vm.box_url = "https://dl.dropboxusercontent.com/u/17905319/vagrant-boxes/squeezy.box"

      grails_web.vm.network :private_network, ip: "10.0.0.#{2 + idx}"
      # ...
    end
  end
end

Installing the Zenoss server

All the machines are provisioned with Chef. For the server, there is a dedicated role in roles/zenoss_server.rb. Besides filling the run list with the zenoss::server recipe, it configures various attributes for Java and the Zenoss installation.
Vagrantfile
  config.vm.define "zenoss" do |zenoss_server|
    # ...
    zenoss_server.vm.provision :chef_solo do |chef|
      # ...
      chef.add_role "zenoss_server"
      # ...

      chef.json = {
        domain: "localhost"
      }
    end
  end
roles/zenoss_server.rb
name "zenoss_server"
description "Configures the Zenoss monitoring server"

default_attributes(
  "zenoss" => {
    "device" => {
      "properties" => {
        "zCommandUsername" => "zenoss",
        "zKeyPath" => "/home/zenoss/.ssh/id_dsa",
        "zMySqlPassword" => "zenoss",
        "zMySqlUsername" => "zenoss"
      }
    }
  }
)

override_attributes(
  "java" => {
    "install_flavor" => "oracle",
    "jdk_version" => "7",
    "oracle" => {
      "accept_oracle_download_terms" => true
    }
  },
  "zenoss" => {
    "server" => {
      "admin_password" => "zenoss"
    },
    "core4" => {
      "rpm_url" => "http://downloads.sourceforge.net/project/zenoss/zenoss-4.2/zenoss-4.2.4/4.2.4-1897/zenoss_core-4.2.4-1897.el6.x86_64.rpm?r=http%3A%2F%2Fsourceforge.net%2Fprojects%2Fzenoss%2Ffiles%2Fzenoss-4.2%2Fzenoss-4.2.4%2F4.2.4-1897%2F&ts=1392587207&use_mirror=skylink"
    },
    "device" => {
      "device_class" => "/Server/SSH/Linux"
    }
  }
)

run_list(
  "recipe[zenoss::server]"
)

Installing the Application Servers

In order to prepare an application server for monitoring, you have to install the SNMP daemon. The Simple Network Management Protocol provides insights into various system parameters like CPU utilization, disk usage, RAM statistics. I bundled my common run list and attributes in roles/monitored.rb
Vagrantfile
  (1..2).each do |idx|
    config.vm.define "grails#{idx}" do |grails_web|
      # ...
      grails_web.vm.provision :chef_solo do |chef|
        # ...
        chef.add_role   "monitored"

        chef.json = {
          domain: "localhost",
        }
      end
    end
  end
roles/monitored.rb
name "monitored"
description "Bundles settings for nodes monitored by Zenoss"

default_attributes()

override_attributes(
  "snmp" => {
    "snmpd" => {
      "snmpd_opts" => '-Lsd -Lf /dev/null -u snmp -g snmp -I -smux -p /var/run/snmpd.pid'
    },
    "full_systemview" => true,
    "include_all_disks" => true
  }
)

run_list(
  "recipe[snmp]"
)

Signing up the Application Servers for Monitoring

Now we must acquaint the Application Servers with Zenoss. As a first step, I did this manually via the Zenoss Web UI. The Web UI is only reachable through the server's loopback interface. To make it accessible from my browser, I tunneled HTTP traffic to the loopback device via SSH:
Terminal
ssh -p 2222 -o "UserKnownHostsFile /dev/null" -o "StrictHostKeyChecking no" -N -L 8080:127.0.0.1:8080 root@localhost
# Password is `vagrant'
Now I can access the UI from localhost:8080.

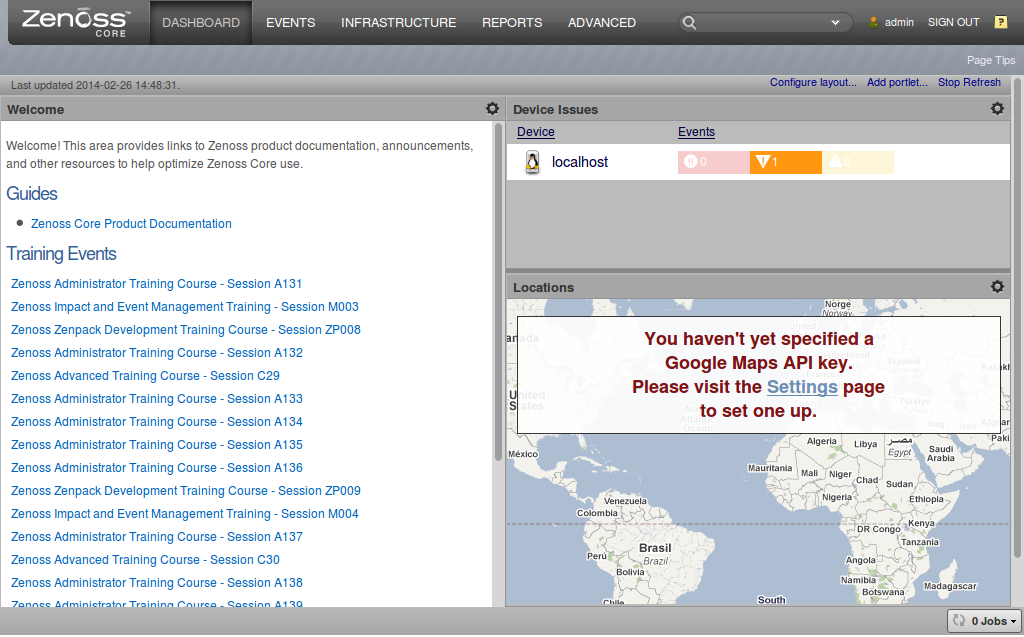
Logging in with the credentials from roles/zenoss_server.rb, we can access the dashboard:

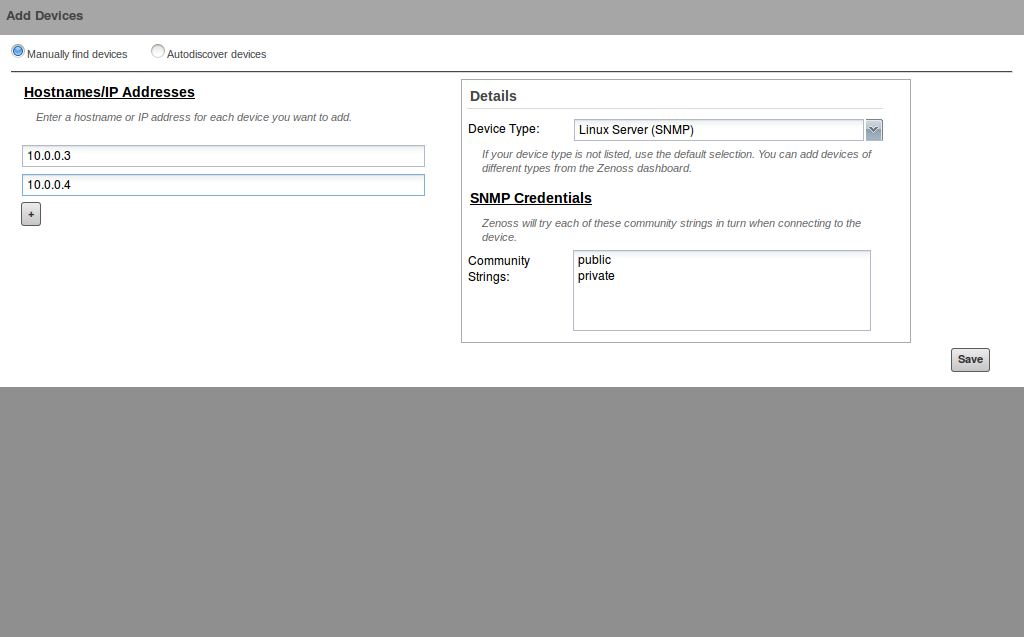
Switching over to the Infrastructure tab, we can Add Multiple Devices:

We input the IP addresses of our two virtual app servers, 10.0.0.3 and 10.0.0.4, and keep the default value for the device type, Linux Server (SNMP).

Now, Zenoss adds these two nodes to its server pool in the background:

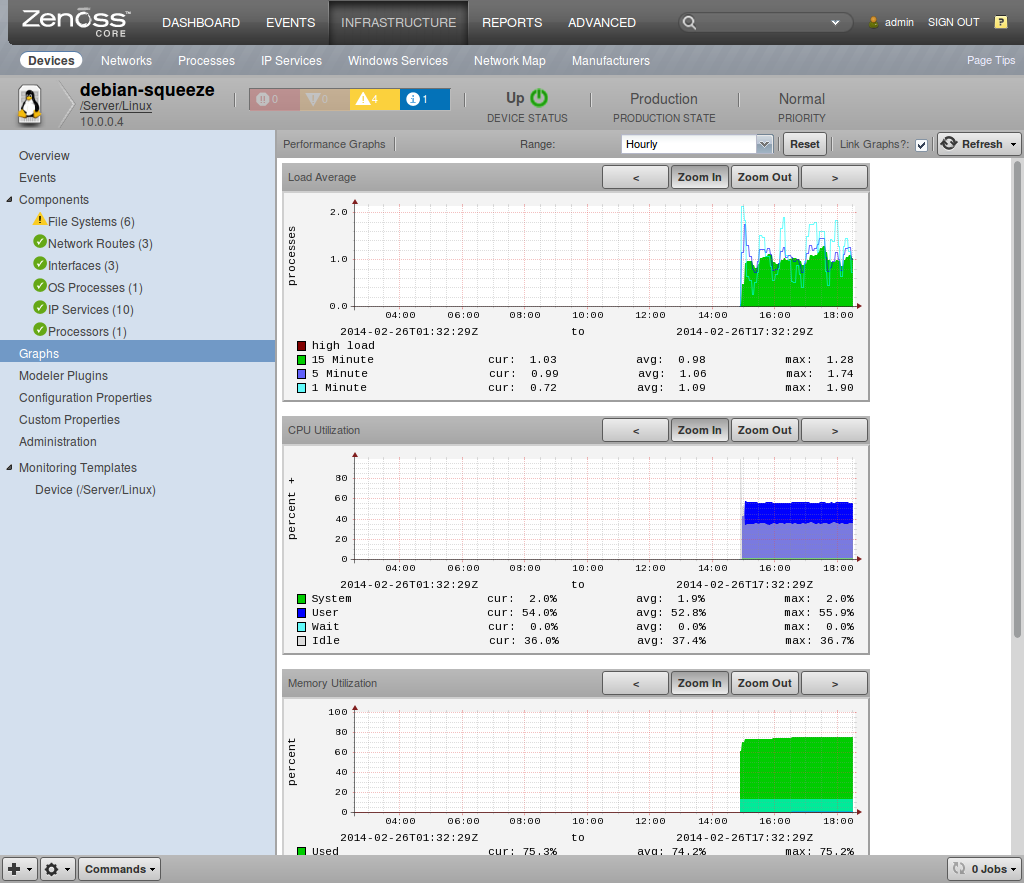
Having finished this, Zenoss starts recording events and measurements of the nodes. This is an example from a simple load scenario of a Grails application on node grails2, 10.0.0.4

Now you are prepared for further exploration of the server performance jungle. All my sources are available from GitHub.

Dienstag, 11. Februar 2014

Zero-Downtime Deployment for Grails Applications

Often, it's okay to have a (short) downtime when deploying a new version of your application. But my recent customer is into a time-critical round-the-clock business. Downtime is very critical, there is only a short window of time for deployment, once a day. In this context, continuous deployment is not an option, which limits the level of support and the possibilities for feedback.

The solution is Blue/Green Deployment. One deploys a new version to an offline service and moves the incoming traffic from the old version to the new one once it's deployed. I adapted a solution from Jakub Holy.
There are several options to deploy different version of an application in parallel to Tomcat. I want to discuss them shortly:

Different context roots

Deploying to different context roots within the same Tomcat container, e.g. localhost:8080/version1, localhost:8080/version2 etc.

Pros

  • No changes to the Tomcat installation or configuration

Cons

  • Requires URL rewriting by the reverse proxy which is harder to configure.
  • Very likely, due to memory leaks, the Tomcat instance will run out of memory (PermGen), and there is no possibility to restart the instance without downtime.

Different Tomcat listeners

One can start multiple listeners within the same container, providing the applications on different ports, e.g. localhost:8080/ and localhost:8081

Pros

  • No changes to the Tomcat installation (startup scripts, default environment variables and paths).

Cons

  • Some changes to the Tomcat config file, server.xml, necessary.
  • Very likely, due to memory leaks, the Tomcat instance will run out of memory (PermGen), and there is no possibility to restart the instance without downtime.

Different Tomcat instances

Last, but definitely not least, there is the "big" solution; start two completely separate Tomcat instances.

Pros

  • It is possible to restart the offline Tomcat instance without any downtime.
  • This enables repeated deployments without running out of memory at some time.

Cons

  • Requires very many changes to the system configuration, because every configuration artifact must be available twice. You need two startup scripts, two Catalina home directories, two server.xml, context.xml, two logging directories and so on.
Being the only option that allows real zero-downtime operations, I chose the latter option.

    Session-Handling

    The last problem to tackle is the session handling. By default, the session information like logins is limited to one application instance. If every deployment requires the users to login again, zero-downtime will result in zero-acceptance, too. The solution to this problem is clustering the two Tomcat instances.
    This requires a few changes to the application itself. The application must be marked as 'distributable'. The simplest way to achieve this is creating a deployment descriptor in src/templates/war/web.xml:
    <web-app ...>
      <display-name>/@grails.project.key@</display-name>
     
      <!-- Add this line -->
      <distributable />
      ...
    </web-app>
    Besides, clustering must be activated in Tomcat's server.xml:
    <Server port="8005" shutdown="SHUTDOWN">
      <!-- ... -->
      <Service name="Catalina">
        <!-- ... -->
        <Engine name="Catalina" defaultHost="localhost">

          <Cluster className="org.apache.catalina.ha.tcp.SimpleTcpCluster"
                   channelSendOptions="8">

            <Manager className="org.apache.catalina.ha.session.DeltaManager"
                     expireSessionsOnShutdown="false"
                     notifyListenersOnReplication="true"/>

            <Channel className="org.apache.catalina.tribes.group.GroupChannel">
              <Membership className="org.apache.catalina.tribes.membership.McastService"
                          address="228.0.0.4"
                          port="45564"
                          frequency="500"
                          dropTime="3000"/>
              <Receiver className="org.apache.catalina.tribes.transport.nio.NioReceiver"
                        address="auto"
                        port="4000"
                        autoBind="100"
                        selectorTimeout="5000"
                        maxThreads="6"/>

              <Sender className="org.apache.catalina.tribes.transport.ReplicationTransmitter">
                <Transport className="org.apache.catalina.tribes.transport.nio.PooledParallelSender"/>
              </Sender>

              <Interceptor className="org.apache.catalina.tribes.group.interceptors.TcpFailureDetector"/>
              <Interceptor className="org.apache.catalina.tribes.group.interceptors.MessageDispatch15Interceptor"/>
              <Interceptor className="org.apache.catalina.tribes.group.interceptors.ThroughputInterceptor"/>
            </Channel>

            <Valve className="org.apache.catalina.ha.tcp.ReplicationValve" filter=""/>
            <Valve className="org.apache.catalina.ha.session.JvmRouteBinderValve"/>

            <ClusterListener className="org.apache.catalina.ha.session.JvmRouteSessionIDBinderListener"/>
            <ClusterListener className="org.apache.catalina.ha.session.ClusterSessionListener"/>
          </Cluster>

        </Engine>
      </Service>
    </Server>
    This configuration enables session replication using TCP multicasting. There are alternatives where session information is persisted to disk which would enable failover and recovery from crashes. But for my scenario—just two Tomcat instances on the same machine—direct TCP synchronization seems sufficient.

    Moving from Blue to Green

    Finally, incoming requests have to be routed to the active Tomcat instance. In my setup, that's the duty of haproxy. As described in the documentation, one can configure haproxy to forward incoming requests to either of several backends.
    To simplify the process of deployment and reconfiguration of haproxy, I developed a little Bash script:
    #!/bin/bash
    if [ $# -ne 1 ]; then
      echo "Usage: $0 <war-file>"
      exit 1
    fi

    set -e
    retry=60
    war_file=$1

    current_link=`readlink /etc/haproxy/haproxy.cfg`
    if [ $current_link = "./haproxy.green.cfg" ]; then
      current_environment="GREEN"
      target_environment="BLUE"
      target_service="tomcat6-blue"
      target_port="8080"
      target_webapps="/var/lib/tomcat6-blue/webapps"
      target_config_file="./haproxy.blue.cfg"
    fi
    if [ $current_link = "./haproxy.blue.cfg" ]; then
      current_environment="BLUE"
      target_environment="GREEN"
      target_service="tomcat6-green"
      target_port="8081"
      target_webapps="/var/lib/tomcat6-green/webapps"
      target_config_file="./haproxy.green.cfg"
    fi
    echo "haproxy is connected to $current_environment backend"

    curl --user deployer:supersecret http://localhost:$target_port/manager/undeploy?path=/
    service $target_service stop

    cp --verbose $war_file $target_webapps/ROOT.war
    service $target_service start
    until curl --head --fail --max-time 10 http://localhost:$target_port/; do
        if [ $retry -le 0 ]; then
          echo "$war_file was not deployed successfully within retry limit"
          exit 1
        fi
        echo "Waiting 5 secs for successful deployment"
        sleep 5
        echo "$((--retry)) attempts remaining"
    done
    ln --symbolic --force --no-target-directory --verbose $target_config_file /etc/haproxy/haproxy.cfg
    service haproxy reload
     

    Putting everything together

    Finally, I collected all of the configuration, scripts, and so on into a Chef cookbook, forked from the original Tomcat cookbook. I provide a GitHub repository that helps you setup a virtual machine with Vagrant and the described Tomcat / haproxy configuration.
    git clone https://github.com/andreassimon/zero-downtime.git
    cd zero-downtime
    bundle install
    librarian-chef install
    vagrant up
    Copy your WAR file into the project directory, and deploy it to the virtual machine:
    cp /home/foo/your-war-file.war .
    vagrant ssh
    sudo -i
    deploy-war /vagrant/your-war-file.war
    Now, you can access the virtual machine in your host browser via http://localhost:8080/.

    Donnerstag, 18. Oktober 2012

    The Agile Manifesto – Refactored

    Most of you know the infamous "Manifesto for Agile Software Development":
    We are uncovering better ways of developing
    software by doing it and helping others do it.
    Through this work we have come to value:
    Individuals and interactions over processes and tools
    Working software over comprehensive documentation
    Customer collaboration over contract negotiation
    Responding to change over following a plan
    That is, while there is value in the items on
    the right, we value the items on the left more.
    The last paragraph is often overlooked which results in counterproductive chaos. This might be related to the specific wording. Recently, another wording occurred to me that might be more intent-revealing and might resolve some misunderstanding. It is a little more focused on the work in agile development.
    We use processes and tools as long as they do not impede individuals and interactions
    We provide comprehensive documentation as long as it does not impede working software
    We do negotiate contracts as long as it does not impede customer collaboration
    We follow a plan as long as it does not impede responding to change
    What do you think?

    Mittwoch, 30. November 2011

    "Models" at Agile Testing Days 2011

    Out there are numerous, brilliant articles on Agile Testing Days 2011. Most of them focus on a single talk or a single conference day. I would like to take another approach: I am going to pick some topic that connects multiple talks and take a look at the conference from this specific point of view.
    The one topic that seems to be the most prominent one is simply "models".

    Definition
    I would like to start by giving my "favorite" (academic) definition of a model. According to Herbert Stachowiak, a model has at least these three attributes:
    • transforming: a model is a transformation of a natural or artificial original (which can be a model by itself),
    • reducing: a model does not include all attributes of the original, but only those that seem to be relevant to the model creator or model user
    • pragmatic: An original does not have a single, unique model. Models are designed to replace the original
      • for certain subjects (who?),
      • within a certain time interval (when?), and
      • in respect to certain mental or real operations (what for?).
    Building Models: Learning
    According to Liz Keogh, learning is the process of building (mental) models. When we build models, we delete, distort and/or add information. Based on observed data, we filter the data, generate assumptions, draw conclusions and finally build beliefs. Unfortunately, our beliefs influence our mental filters and thus might constrain our ability to learn. In order to improve our filters we have to adjust our beliefs.
    As Esther Derby pointed out, humans are good at spatial reasoning, but bad at temporal reasoning. When we have to analyze temporal problems, we should try to convert them into spatial problems. One option is a graphical model of temporal data, e.g. time lines.
    Michael Bolton gave a very good demonstration of the model building process. In the TestLab, he built a model of an application under test through Exploratory Testing. Based on James Bach's "Heuristic Test Strategy Model", he developed a rather comprehensive mind map describing the product and came up with lots of ideas for further testing activities. It became obvious that "Exploratory Testing is simultaneous test design, test execution and learning."

    Using Models
    David Evans emphasized that "[test] coverage is [implicitly] measured by reference to models". That is why "you can have complete coverage of a model, but you can never have a complete model". This is due to the reducing nature of any model. And finally David pointed out that "the more complete the model is, the less you can economically cover."
    When it comes to complex systems, "there are no clear cause and effect relationships. Accept Uncertainty and complexity. Experiment and measure what really makes things better" (Liz Keogh). You might visualize some relationships using Diagrams of Effects aka. Causal Loop Diagrams (Esther Derby)
    Gojko Adzic presented two specific models during the conference: effect maps are a way to model the relationships between software features and a business goal. They can be used to deduce possible activities from a business goal, select the most promising activities and measure their impact on the business.
    Gojko started the initiative visualisingquality.org to gather models that facilitate the communication of quality attributes to stakeholders and management. He presented the ACC Matrix that was developed by James Whittaker at Google as one measure.

    And What's the Tester's Job?
    In a nutshell, testers challenge / break models. They help developers to make more accurate models (Liz Keogh). Thus, model creation is one of the main responsibilities of effective testers.

    Donnerstag, 3. November 2011

    On the Status of SoCraMOB (Software Craftsmanship in Münster,Osnabrück,Bielefeld)

    From September 1 through September 2 I participated in SoCraTes 2011, a gathering of German software developers who are interested in Software Craftsmanship. It became the spark for a German Software Craftsmanship Community that is now organized under the label "Softwerkskammer". Me and three other participants volunteered to build up a regional community in Münster/Bielefeld/Osnabrück.
    On October 19 we set up a kick-off meeting in the .space Osnabrück. Fortunately there are quite a few other people in the area who are deeply interested in the matter. It was easy to mobilize them for the kick-off. There were 11 people in the meeting; only four of them had been to SoCraTes!
    In my opinion we had a great discussion on different aspects of Software Craftsmanship - agile processes, domain-driven design, test-driven development, educating junior developers. All the attendees were very energized.
    This was the beginning of the regional community; we named it "SoCraMOB" ("Software Craftsmanship in Münster, Osnabrück & Bielefeld").
    It turned out that a relevant number of members live/work in Münster. And people did not feel up to traveling to one of the other cities for (short) evening events in the future. We agreed on a different form of meetings: We are going to organize whole-day workshops on every second Saturday in a quarter. The program will be a mixture of open space sessions and coding dojos. The first one will be on January 14 in Münster. The members in each of the cities are free to organize local events.
    Besides, Martin Klose and Jaroslaw Klose are going to stage a code retreat in Bielefeld in the context of the Global Day of Code Retreat.
    The next step is to spread the word in the area. We already talked to the local .NET User Group on October 26. The people there were all energized and interested in the matter, too; all developers across technological barriers seem to have similar problems in terms of organization, development process, and team communication. The .NET User Group set up a coding dojo immediately for November 30.
    The local Münster community are going to meet for a round-table on December 21. One of the topics will be the organization of the first SoCraMOB on January 14.

    Montag, 17. Oktober 2011

    Kick-Off: Software Craftsmanship in Münster/Osnabrück/Bielefeld

    During the kick-off meeting for the German Software Craftsmanship Community (SoCraTes 2011) from September 1st through September 3rd I joined a group of participants who want to organize a regional Software Craftsmanship Community in the area of Münster/Osnabrück/Bielefeld.
    I am happy to announce the first community meeting for the next Wednesday, October 19th, in the .space Osnabrück. We hope to bring several people from the area together. We are going to discuss what modern sensible software development should look like nowadays. Whatever language you use or which frameworks you employ, everybody is warmly welcome.
    For more information and registration please see the Xing event page.

    Montag, 20. Juni 2011

    My (unauthoritative) list of book recommendations

    After my workshop on Ruby on Rails on Saturday I was asked to recommend some books on programming, Agile and similar topics. I don't feel like an authority, because I didn't read at least half of the books I assume to be import. But these are my current recommendations.
    (I allowed myself to link the titles to Amazon using a personalized link; when you order one of the books by following a link within this post I will be rewarded a small amount of money; you might reward my gratuitious engagement for the SkillShare workshop this way)

    Ruby on Rails books

    I just advice the classics on Ruby and Rails:

    My personal top 3

    1. Martin Fowler: "Refactoring" (also available as Ruby Edition). This book was a real eye-opener for me. Afterwards software was way "softer" to me. I became able to knead my code towards the direction I want.
      And besides, Refactoring is the basic ability in becoming agile. It enables you to evolve and extend your code and it is one of the three phases in TDD which is the next level when becoming agile.
    2. Robert "Uncle Bob" Martin: Clean Code. This book literally boosted the quality of my code. It gives lots of tips on the common principles when programming like good naming, refactoring the code, unit-testing, concurrency, and so on.
    3. Lasse Koskela: "Test Driven". This book was a key source for my diploma thesis in 2010. It gives a nice introduction to TDD, ATDD and an agile development process. A nice book to get you started.
    This list might change with the next Amazon shipping ;-)

      Books I'm about to read / I was adviced to read

      When you are interested in more books, just leave a comment and I will post further tips. You might also name a specific topic.

      Montag, 6. Juni 2011

      Introducing New Features - Done Right

      One of my customers offers articles in campaigns to his customers and allows orders for these campaigns. Once upon a time I was involved in the creation of the specific web application with some fellow students. And I am still engaged in maintaining and extending the system.
      So far there was the restriction that there are no temporally parallel campaigns, they had to be in strict chronological order. Now my client wants to offer several campaigns at a time. Up to now, the concept of a "campaign" was hidden within a GUI component, namely a JavaServer Faces backing bean. So the following requirements had to be fulfilled:
      • Present multiple, parallel campaigns to the customer
      • Select one of those campaigns
      • Present the order process for the selected campaign
      So first of all, as an apprentice of the Acceptance Test-Driven Development community, I wrote an acceptance test for the new feature (slightly simplified):
      Given there is an active campaign C with product P
      And there is an active campaign D with product Q
      When I order 17 pieces of P
      And I order 42 pieces of Q
      Then I want to receive 17 pieces of P
      And 42 pieces of Q
      
      Afterwards I automated the acceptance test as an end-to-end test using Selenium/Webdriver 2. Good boy!

      The Mistake

      I carried out the necessary implementation steps in the wrong order.
      1. First of all I blew up all of my unit / integration tests by introducing a list of the former unknown concept "Campaign". Afterwards it took me more than a week to move the functionality from the backing bean to the new Campaign class and refit the existing tests.
      2. Bad enough, but I could do worse. I spotted several dirty parts in the existing nested objects of Campaign, respectively the backing bean (e.g. an Order or an OrderLine). And I started to fix them immediately: specialize and devide some functionality in subclasses, generalize other parts and so on. But I didn't formulate and rearrange my unit tests first, I just changed the production code. So while my tests were already failing, I changed the production code even further, breaking more and more tests. So what should have been a small change ended up in more than a week of work for a single commit...

      So what went wrong?

      While succeeding in ATDD, I simply missed basic concepts of TDD:

      1. Test comes first, afterwards refactor the code or write new code to pass the test.
      2. When a change is hard to do, refactor first to enable the change.

      I didn't evolve the new functionality from the existing one, but did a rewrite in fact (and reused parts of the existing code).

      How you do better

      At first, extract the concept of a Campaign from the backing bean (Extract Class Refactoring); reference just one Campaign from the backing bean. By forwarding the method calls to the backing bean to the new Campaign object, all of the tests stay green while moving attributes and methods. When all of the functionality is moved bit by bit to the new Campaign class, you can inline the delegating methods in the backing bean (Inline Method Refactoring). So these methods disappear and the access to the newly created Campaign field will become explicit in the tests. Finally move the existing tests concerning the functionality of Campaign from the existing BackingBeanTest to a new CampaignTest. All the tests stay green all the time. And that gives you
      • little risk
      • more confidence
      • and a whole lot of fun. Commit.
      While browsing the code you might spot some ugly parts. But don't touch them while changing another part of the system. Simply write it down on your todo-list. When your first change is done, you can turn toward the next item. When you want to rename some of your classes for the sake of more expressiveness, you can search for the corresponding name in your build path. Then you rename the class, all references to that class, the corresponding test class, and the variables referencing an object of the class, consistently (Rename Class Refactoring). Commit.
      One method to clean up a class violating the Single Responsibility Principle is creating subclasses addressing the different responsibilities. You split up the existing test class into two separate test classes. You can then pick the necessary test cases / methods from the former test class and assign them to the new test classes by their relevance to the former mixed up responsibilities (similar to the Replace Type Code With Subclasses Refactoring, see also the "Anti-If" school). You can pull up common custom assertions into the superclass. After reorganizing the test cases you can split the production code into two subclasses, move the method and fields specific to just one subclass in the corresponding file and keep common functionality in the superclass. This process takes a little more time but it's a task of reasonable size. Commit.
      Ah, and finally you can introduce the list of Campaigns easily and determine the selected one in the backing bean. Change done. Acceptance test passes. Mission accomplished.

      What I learned from my mistake

      • Refactoring and evolving a new functionality are fundamentally different. The sequence of the steps is nearly inverse.
      • Refactoring demands more discipline.
      • And the top priority is the following: don't ever break your tests!

      Montag, 23. Mai 2011

      Simplifying JMock Expectations

      I like to use JMock for mocking depending objects when test-driving my code. It allows a very readable description of mock object behaviour. Readability is my first priority when writing tests so that they are easy to understand later, too, and can be used as a valuable documentation of the intended behaviour. In order to lift the readability of JMock expectations I used a generalized implementation of the "Object Mother"-Pattern.

      The "Object Mother"-Pattern

      The "Object Mother"-Pattern is known to express in a succinct form what makes an object special.
      Let's assume we have a domain object Person with the two attributes name and surname.
      class Person {
        String _name, _surname;
        
        public Person(String name, String surname) {
          _name = name;
          _surname = surname;
        }
      }
      

      When we want to assure that a Person object with an empty surname is rejected by a PersonRepository when trying to save it, the simple solution would be the following:
      @ExpectedException(ConstraintViolationException.class)
      @Test public void shouldRejectPersonWithEmptySurname {
        Person personWithEmptySurname = new Person("Name", "");
      
        personRepository.save(personWithEmptySurname);
      }
      

      Though this is quite good (when using intent-revealing names), it becomes tedious when you want to test the behaviour in all possible attribute combinations. That's why the "Object Mother"-Pattern is handy. A possible ObjectMother for Person is:

      class PersonMother {
        Person _child = new Person("Name", "Surname");
      
        PersonMother withEmptyName() {
          _child._name = "";
          return this;
        }
        
        PersonMother withEmptySurname() {
          _child._surname = "";
          return this;
        }
        
        Person build() {
          return _child;
        }
      }
      

      Using the PersonMother and a simple factory method we can simplify the test code:

      @ExpectedException(ConstraintViolationException.class)
      @Test public void shouldRejectPersonWithEmptySurname {
        personRepository.save(aPerson().withEmptySurname().build());
      }
      
      PersonMother aPerson() {
        return new PersonMother();
      }
      

      And the PersonMother simplifies the combination of attributes, too:

      @ExpectedException(ConstraintViolationException.class)
      @Test public void shouldRejectPersonWithEmptyNameAndSurname {
        personRepository.save(
            aPerson()
              .withEmptyName()
              .withEmptySurname().build());
      }
      

      Using the Object Mother for JMock expectations

      After this excursus in the world of patterns, I am approaching my point, finally. Assuming that we want to test the behaviour of a service that depends on a PersonRepository to access persisted persons. In order to test the service in isolation, I mock the PersonRepository. I want to test the behaviour of the service depending on the contents of a returned Person. So we want to return different persons from the mocked repository. With "plain" JMock this results in the following setup code for our mock:

      PersonRepository mockPersonRepository = context.mock(PersonRepository.class);
      context.checking(new Expectations() {{
        oneOf(mockPersonRepository).get(1); returnValue(aPerson().withoutSurname().build());
      }});
      [...]
      

      Not bad, actually. Very expressive and readable. But since I am quite a perfectionist, I am bothered by the required call to build(). So, let's see if we can simplify this further.

      At first, I extract a generic interface from PersonMother:
      interface ObjectMother<T> {
        T build();
      }
      
      class PersonMother implements ObjectMother<Person> {
        [...]
      }
      

      Afterwards, I create a new method to use in JMock expectations:

      static Action returns(ObjectMother<?> objectMother) {
        return new ReturnValueAction(objectMother.build());
      }
      

      With these two ingredients I am able to reduce the mock setup code as I wanted:

      PersonRepository mockPersonRepository = context.mock(PersonRepository.class);
      context.checking(new Expectations() {{
        oneOf(mockPersonRepository).get(1); returns(aPerson().withoutSurname());
      }});
      [...]
      

      Montag, 21. Februar 2011

      Visual Kanban Principles

      In order to prepare for a little introduction on Kanban that I will give later this week, I created a visual Mindmap of the principles. I want to share it with you, maybe it's helpful to anyone of you. The labels are in German. If you are interested in the XMind file, drop me a line.

      Best regards!

      Samstag, 19. Februar 2011

      Photographic Testing: Lessons learned from Belgium Testing Days 2011

      During Belgium Testing Days 2011, I learned a lot about teaching and - surprise, surprise - about software testing. When I took a walk around the city of Brussels with my camera the day after the conference, I reflected what I had learned while taking some photos and a little parable came to my mind which I would like to share with you.

      Almost every person took a photo sometime. Lots of people nowadays think taking a photo is easy. The same applies to software testing. A lot of people tested some software and a lot of these people think, testing is easy. Well, that depends.¹

      It is relatively easy to do simple regression testing (what should better be called regression checking). And it's relatively easy to take a simple photo. The advantage is: these things can be easily automated. This is state of the art in photography. Take a look at autofocus or automatic exposure. And automation in testing is becoming more and more popular (see TDD, BDD, ATDD and so on). The disadvantage is: both of them seldomly convey interesting information. A simple picture is almost always boring.² And regression testing has a 30% chance of finding a bug at most. To find out interesting information, you need (human) skill.² The first skill for a photographer and a tester is knowing his tools. There are lots of them in photography, often paralleled in testing.

      Change your aperture
      You can change the aperture of your lens, resulting in more or less depth of field. In software testing, you can change your scope. You can choose to take a broader or a more narrow view. See the application as a whole or pick out specific functionality or specific qualities.
      (c) http://www.digicamguides.com/


      Change your shutter speed
      Changes in the shutter speed result in "frozen" or "fluent" images. In testing you can take a static or dynamic look on your product. Watch it with a static number of users or ramp up the load. You can spend less or more time on testing your area of choice. But beware! Sometimes longer exposure results in more blurry results ;-)
      (c) Flagstaffotos 2007 licensed under GNU Free Documentation License

      Change your focal point
      Different focal points make near or far objects sharp. You can focus on different levels of depths of your product likewise. Just walk the happy paths or explore the whole functionality in depth. Test your system through the UI or "crawl under the skin" and test the API.
      (c) Brien Szabo - http://www.natureimages321.com

      Change your sensitivity
      With modern cameras, you can easily adjust the sensitivity of your sensor, too, resulting in brighter or darker images with more or less visible details. As a tester, you can work at different levels of sensitivity, too. You can be open to any problems you see or you can be focused on specific types of bugs in specific areas, such as usability problems in the order function of your web shop.
      (c) Andreas Simon 2011

      Change your colour
      With modern cameras you can easily adjust the white balance of the sensor, which influences the colour of your image in consequence. Your "testing balance" influences your results, too. More exploratory testing will show you more bugs than simple regression testing.
      (c) Spiritia licensed under GNU Free Documentation License
      Change your perspective
      One of the most important means for a photographer - and a tester - is the perspective. You can move nearer to the subject or you can step back. You can go to the left or to the right. And you can kneel down or climb on a wall. Every step influences your picture and eventually you reach an interesting or even awesome photo.
      In testing, you should change your perspective from time to time, too. Look at the application from the point of view of different user personas. "What would Homer Simpson do?" (Lisa Crispin). What would Mark Zuckerberg do? What would the kind hacker from your neighbourhood do? These questions lead you to interesting results.
      (c) Andreas Simon 2011
      Use special tools for special purposes
      Extraordinary situations require extraordinary means. These are very specialized, mostly very expensive and sometimes heavyweight. But you just need them at time. Be it large lenses like the one shown below, be it a special GUI testing library, be it the cloud application for generating load on your servers, be it training, coaching or services.
      (c) Ryan Foong 2011

      Interaction
      You see, there are lots of instruments. Some influence a single property of your image, some influence several aspects. Sometimes you have several means to influence the same attribute. The same is true for testing tools and methods.

      Due to the scarcity of resources, e.g. light in photography and time in testing, the tools interact absolutely. When you want a "frozen" image, you probably have to make it more blurry, in order to get a well exposed photo. When you cannot raise your man power and you want to do more exploratory testing, you will have to do less (manual) regression checking for example. (Hm, maybe automating dumb tests could also be an alternative. But, that's just a thought ;-)

      Back and forth
      Take a "big picture" first, to get an overview and a first impression of your subject. Afterwards, select interesting details and try to work out their characteristics. Zoom in, approach them and watch them from different angles. Search for the pictures within the picture. Focus on a special area of your subject. Get an overview of your system under test at first. After having more information about the intended use of your customer, you can enter the areas of interest in detail.

      Build on your social skills
      Watch the people in interaction with their environment. It's often very interesting and insightful, and sometimes even funny.
      (c) Wladyslaw Sojka 2007, licensed under GNU Free Documentation License
      Ask for help. Sometimes other people allow you to reach an angle of view that you cannot reach on your own. Try to go to a high flat in the opposite building for bird view.
      Talk to the best informed people of your domain of interest. In order to find interesting places in a city, a local resident might be your help. In order to find interesting areas of your application, talk to your customer. He can tell you which areas might be risky (from the business point of view). He can tell you what areas are hard to use or buggy.

      Be economic
      Sometimes the best picture is not affordable. Renting (or even buying) an elevating truck in order to get to the right point of view is not worth the cost. And asking for another thousand users to test your product might not yield any relevant insight.
      (c) Michał Derela 2007, licensed under GNU Free Documentation License

      Explore
      Be it the city you are visiting, be it a software product. You might find interesting places, that are not in your guide book / your specification / user manual. Sometimes you will come to a dead end. Then, take a step back and explore another direction.
      (c) David Stowell 2007, licensed under Creative Commons Attribution-ShareAlike 2.0
      Look out for interesting differences (Belgians cross the street on red light; this is very extraordinary for me as a German guy). Maybe the user experience in your application is not consistent either.
      (c) Andreas Simon 2011

      Test the boundaries
      Sometimes, good pictures are only possible under unusual conditions. A bathing beach will be much more attractive at sunset than at bright noon light. Wild animals are very shy, you have to wait for hours or days for the special single moment when they cross your way. Try out the edge cases in testing alike. These are the region where most of the defects are found.
      (c) RonAlmog 2006, licensed under Creative Commons Attribution 2.0 Generic
      Be creative

      Play around with your tools to reach better results, both images and test reports. Sometimes you are surprised by reality. I was surprised that Manneken Pis for example is actually relatively small, I supposed it to be life-size.
      (c) Andreas Simon 2011


      Finally, give a try to serious photography. "Photography is learning to see [properly and precisely]" (Andreas Feininger). And this is on its own a very valuable skill for testers.

      This article was inspired by Belgium Testing Days 2011, especially:
      Another source of inspiration was the interview with Michael Bolton and James Bach (Agile Record 05, January 2011): bring knowledge from other disciplines into testing.


      ¹ This is probably the most important sentence I was told at university and during BTD2011
      ² "I believe that photography at its best is an Art, and photo-technique is but a means to an end: the creation of the picture. Today, even a fool can learn to operate any of our modern foolproof cameras, and produce technically perfect pictures -- but is this knowledge really all he needs for taking purposeful and pictorially exciting photographs? Naturally, as in any other art, there are artists and there are dabblers. If photography really were nothing but the simple and purely mechanical reproduction process the majority of people still think it is, why are there so many dull and meaningless photographs around?" - Andreas Feininger