Montag, 10. März 2014

Capturing SNMP Values During Load Tests

After capturing and analyzing response times I need some monitoring data to correlate the results to. As far as I could find out, JMeter does not provide means to capture system attributes like CPU, memory, and I/O utilization. So I set off to build something on my own. My application servers run a SNMP daemon. It seemed to obvious to query system data via the available service.

Preparation

In order to query SNMP data I had to install some Debian packages:
/install-packages.sh
sudo apt-get install \
  snmp \
  snmp-mibs-downloader
The snmp package provides the required command line tools, especially snmpget and snmpwalk. snmp-mibs-downloader provides Management Information Base files in the directory /usr/share/snmp/mibs SNMP data structures.
SNMP structures the management information in a numerical, hierarchical format that is very hard to reason about:
/snmpwalk.sh
snmpwalk -v2c -c public 10.0.0.3
iso.3.6.1.2.1.1.1.0 = STRING: "Linux bay5 3.2.0-59-generic #90-Ubuntu SMP Tue Jan 7 22:43:51 UTC 2014 x86_64"
iso.3.6.1.2.1.1.2.0 = OID: iso.3.6.1.4.1.8072.3.2.10
iso.3.6.1.2.1.1.3.0 = Timeticks: (145234) 0:24:12.34
iso.3.6.1.2.1.1.4.0 = STRING: "Root <root@localhost>"
iso.3.6.1.2.1.1.5.0 = STRING: "bay5"
iso.3.6.1.2.1.1.6.0 = STRING: "Server Room"
iso.3.6.1.2.1.1.8.0 = Timeticks: (0) 0:00:00.00
iso.3.6.1.2.1.1.9.1.2.1 = OID: iso.3.6.1.6.3.10.3.1.1
iso.3.6.1.2.1.1.9.1.2.2 = OID: iso.3.6.1.6.3.11.3.1.1
iso.3.6.1.2.1.1.9.1.2.3 = OID: iso.3.6.1.6.3.15.2.1.1
iso.3.6.1.2.1.1.9.1.2.4 = OID: iso.3.6.1.6.3.1
iso.3.6.1.2.1.1.9.1.2.5 = OID: iso.3.6.1.2.1.49
iso.3.6.1.2.1.1.9.1.2.6 = OID: iso.3.6.1.2.1.4
iso.3.6.1.2.1.1.9.1.2.7 = OID: iso.3.6.1.2.1.50
iso.3.6.1.2.1.1.9.1.2.8 = OID: iso.3.6.1.6.3.16.2.2.1
iso.3.6.1.2.1.1.9.1.3.1 = STRING: "The SNMP Management Architecture MIB."
iso.3.6.1.2.1.1.9.1.3.2 = STRING: "The MIB for Message Processing and Dispatching."
iso.3.6.1.2.1.1.9.1.3.3 = STRING: "The management information definitions for the SNMP User-based Security Model."
iso.3.6.1.2.1.1.9.1.3.4 = STRING: "The MIB module for SNMPv2 entities"
iso.3.6.1.2.1.1.9.1.3.5 = STRING: "The MIB module for managing TCP implementations"
iso.3.6.1.2.1.1.9.1.3.6 = STRING: "The MIB module for managing IP and ICMP implementations"
iso.3.6.1.2.1.1.9.1.3.7 = STRING: "The MIB module for managing UDP implementations"
iso.3.6.1.2.1.1.9.1.3.8 = STRING: "View-based Access Control Model for SNMP."
# ~2300 more entries
The Management Information Base provides metadata that provide human-readable names and categories. To activate MIBs I have to set the MIBS environment variable:
/capture-snmp.sh
export MIBS=ALL
Afterwords, the output is easier to understand:
/snmpwalk-mibs.sh
$ snmpwalk -v2c -c public 10.0.0.3
SNMPv2-MIB::sysDescr.0 = STRING: Linux bay5 3.2.0-59-generic #90-Ubuntu SMP Tue Jan 7 22:43:51 UTC 2014 x86_64
SNMPv2-MIB::sysObjectID.0 = OID: NET-SNMP-TC::linux
DISMAN-EVENT-MIB::sysUpTimeInstance = Timeticks: (201014) 0:33:30.14
SNMPv2-MIB::sysContact.0 = STRING: Root <root@localhost>
SNMPv2-MIB::sysName.0 = STRING: bay5
SNMPv2-MIB::sysLocation.0 = STRING: Server Room
SNMPv2-MIB::sysORLastChange.0 = Timeticks: (0) 0:00:00.00
SNMPv2-MIB::sysORID.1 = OID: SNMP-FRAMEWORK-MIB::snmpFrameworkMIBCompliance
SNMPv2-MIB::sysORID.2 = OID: SNMP-MPD-MIB::snmpMPDCompliance
SNMPv2-MIB::sysORID.3 = OID: SNMP-USER-BASED-SM-MIB::usmMIBCompliance
SNMPv2-MIB::sysORID.4 = OID: SNMPv2-MIB::snmpMIB
SNMPv2-MIB::sysORID.5 = OID: TCP-MIB::tcpMIB
SNMPv2-MIB::sysORID.6 = OID: RFC1213-MIB::ip
SNMPv2-MIB::sysORID.7 = OID: UDP-MIB::udpMIB
SNMPv2-MIB::sysORID.8 = OID: SNMP-VIEW-BASED-ACM-MIB::vacmBasicGroup
SNMPv2-MIB::sysORDescr.1 = STRING: The SNMP Management Architecture MIB.
SNMPv2-MIB::sysORDescr.2 = STRING: The MIB for Message Processing and Dispatching.
SNMPv2-MIB::sysORDescr.3 = STRING: The management information definitions for the SNMP User-based Security Model.
SNMPv2-MIB::sysORDescr.4 = STRING: The MIB module for SNMPv2 entities
SNMPv2-MIB::sysORDescr.5 = STRING: The MIB module for managing TCP implementations
SNMPv2-MIB::sysORDescr.6 = STRING: The MIB module for managing IP and ICMP implementations
SNMPv2-MIB::sysORDescr.7 = STRING: The MIB module for managing UDP implementations
SNMPv2-MIB::sysORDescr.8 = STRING: View-based Access Control Model for SNMP.
# ~2300 more entries
In addition, there are categories of values that can be queried, e.g. systemStats or memory:
/capture-snmp.sh
snmpwalk -v2c -c public 10.0.0.3 systemStats > 10.0.0.3.systemStats.snmpwalk
snmpwalk -v2c -c public 10.0.0.3 memory      > 10.0.0.3.memory.snmpwalk
/10.0.0.3.systemStats.snmpwalk
UCD-SNMP-MIB::ssIndex.0 = INTEGER: 1
UCD-SNMP-MIB::ssErrorName.0 = STRING: systemStats
UCD-SNMP-MIB::ssSwapIn.0 = INTEGER: 0 kB
UCD-SNMP-MIB::ssSwapOut.0 = INTEGER: 0 kB
UCD-SNMP-MIB::ssIOSent.0 = INTEGER: 6 blocks/s
UCD-SNMP-MIB::ssIOReceive.0 = INTEGER: 0 blocks/s
UCD-SNMP-MIB::ssSysInterrupts.0 = INTEGER: 62 interrupts/s
UCD-SNMP-MIB::ssSysContext.0 = INTEGER: 124 switches/s
UCD-SNMP-MIB::ssCpuUser.0 = INTEGER: 1
UCD-SNMP-MIB::ssCpuSystem.0 = INTEGER: 0
UCD-SNMP-MIB::ssCpuIdle.0 = INTEGER: 97
UCD-SNMP-MIB::ssCpuRawUser.0 = Counter32: 3112
UCD-SNMP-MIB::ssCpuRawNice.0 = Counter32: 0
UCD-SNMP-MIB::ssCpuRawSystem.0 = Counter32: 366
UCD-SNMP-MIB::ssCpuRawIdle.0 = Counter32: 16735
UCD-SNMP-MIB::ssCpuRawWait.0 = Counter32: 96
UCD-SNMP-MIB::ssCpuRawKernel.0 = Counter32: 0
UCD-SNMP-MIB::ssCpuRawInterrupt.0 = Counter32: 33
UCD-SNMP-MIB::ssIORawSent.0 = Counter32: 5482
UCD-SNMP-MIB::ssIORawReceived.0 = Counter32: 203276
UCD-SNMP-MIB::ssRawInterrupts.0 = Counter32: 31382
UCD-SNMP-MIB::ssRawContexts.0 = Counter32: 68221
UCD-SNMP-MIB::ssCpuRawSoftIRQ.0 = Counter32: 13
UCD-SNMP-MIB::ssRawSwapIn.0 = Counter32: 0
UCD-SNMP-MIB::ssRawSwapOut.0 = Counter32: 0
/10.0.0.3.memory.snmpwalk
UCD-SNMP-MIB::memIndex.0 = INTEGER: 0
UCD-SNMP-MIB::memErrorName.0 = STRING: swap
UCD-SNMP-MIB::memTotalSwap.0 = INTEGER: 466936 kB
UCD-SNMP-MIB::memAvailSwap.0 = INTEGER: 466936 kB
UCD-SNMP-MIB::memTotalReal.0 = INTEGER: 1026948 kB
UCD-SNMP-MIB::memAvailReal.0 = INTEGER: 632672 kB
UCD-SNMP-MIB::memTotalFree.0 = INTEGER: 1099608 kB
UCD-SNMP-MIB::memMinimumSwap.0 = INTEGER: 16000 kB
UCD-SNMP-MIB::memBuffer.0 = INTEGER: 4116 kB
UCD-SNMP-MIB::memCached.0 = INTEGER: 97152 kB
UCD-SNMP-MIB::memSwapError.0 = INTEGER: noError(0)
UCD-SNMP-MIB::memSwapErrorMsg.0 = STRING: 

Capturing Data Regularly

As a first step, I was fine with just capturing CPU and memory statistics. Selectively querying this information was quite valueable, because a full snmpwalk turned out to be too expensive and influenced the test results. I wrote a small script to record systemStats and memory every 60 seconds:
/capture-snmp-regularly.sh
host=$1
interval=${2:-60}

export MIBS=ALL
while true; do
  timestamp=$(date +%s%N | cut -b1-13)
  record_dir="$host/$timestamp"
  echo "Recording SNMP indicators to $record_dir/"
  mkdir --parents "$record_dir"
  snmpwalk -t 1 -v2c -c public $host systemStats > $record_dir/$host.systemStats.snmpwalk
  snmpwalk -t 1 -v2c -c public $host memory      > $record_dir/$host.memory.snmpwalk
  sleep $interval
done
The results are organized hierarchical in directories by host and the timestamp.

Cleaning Up and Collecting the Captured Data

To prepare the data for analysis with R, I stripped out some uninteresting tokens:
/cleanup-snmp-data.sh
#!/bin/bash
cat - | \
  sed "s/UCD-SNMP-MIB:://" | \
  sed "s/INTEGER: //" | \
  sed "s/STRING: //" | \
  sed "s/Counter32: //" | \
  sed "s/\.0//" | \
  sed "s/ = /,/g"
Afterwards I wrote a script to traverse the directories, read the snmpwalk data, clean it up and prepending the host name and timestamp.
/collect-snmp-data.sh
#!/bin/bash
for recording in $( ls --directory */*/ ); do
  host=$( echo "$recording" | sed 's/\([0-9]\+\.[0-9]\+\.[0-9]\+\.[0-9]\+\)\/\([0-9]\+\)\//\1/' )
  timestamp=$( echo "$recording" | sed 's/\([0-9]\+\.[0-9]\+\.[0-9]\+\.[0-9]\+\)\/\([0-9]\+\)\//\2/' )
  cat $host/$timestamp/*.snmpwalk | ./cleanup-snmp-data.sh | sed "s/^/$host,$timestamp,/"
done 
Executing ./collect-snmp-data > snmp.csv produces a neat CSV file, ready for R.

Plotting the Data

Finally, I plotted the data with R.
/snmp.R
snmps<-read.table("snmp.csv",
                  header=FALSE,
                  col.names=c('host','timestamp','valueType','value'),
                  colClasses=c('factor','numeric','factor','character'),
                  sep=","
)
ssCpuUser<-snmps[ snmps$valueType == 'ssCpuUser', ]
plot((ssCpuUser$timestamp-min(ssCpuUser$timestamp))/1000/60,
     ssCpuUser$value,
     type='o',
     main=expression(bold(paste(ssCpuUser, ", ", 1-textstyle(frac(memAvailReal, memTotalReal))))),
     xlab="Test time [min]",
     ylab="Utilization [%]",
     ylim=c(0,100),
     col="purple",
     pch=18
)

timestamps<-snmps[ snmps$valueType == 'memTotalReal', ]$timestamp
memTotalReal<-as.numeric(sub("([0-9]+) kB", "\\1", snmps[ snmps$valueType == 'memTotalReal', ]$value))
memAvailReal<-as.numeric(sub("([0-9]+) kB", "\\1", snmps[ snmps$valueType == 'memAvailReal', ]$value))
reservedMem<-1-memAvailReal/memTotalReal

lines((timestamps-min(timestamps))/1000/60,
      reservedMem*100,
      type='o',
      ylim=c(0,100),
      col="orange",
      pch=18
)
legend(0, 20,
       c("ssCpuUser", expression(1-textstyle(frac(memAvailReal, memTotalReal)))),
       col=c("purple", "orange"),
       yjust=0.5,
       pch=18
)
Combined with the response times from JMeter, I got the following image:

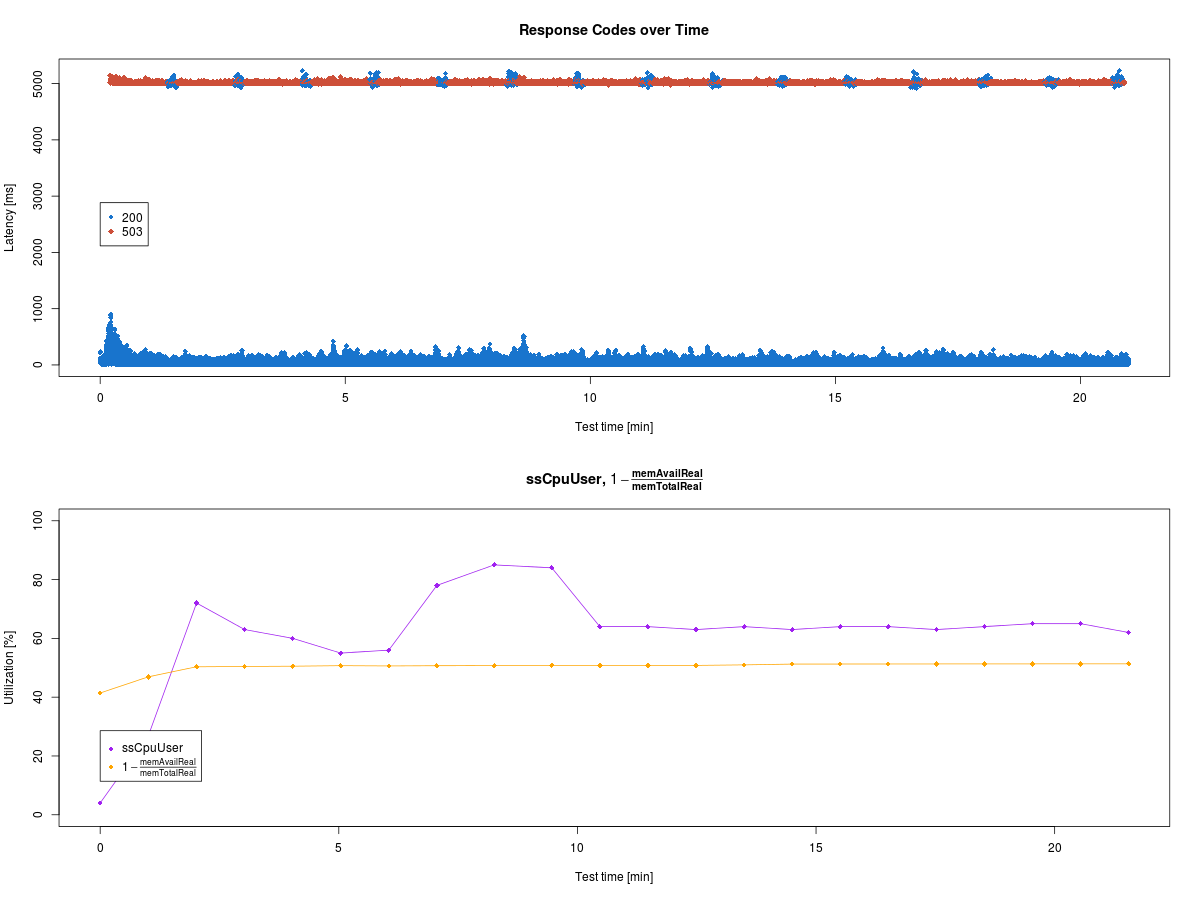
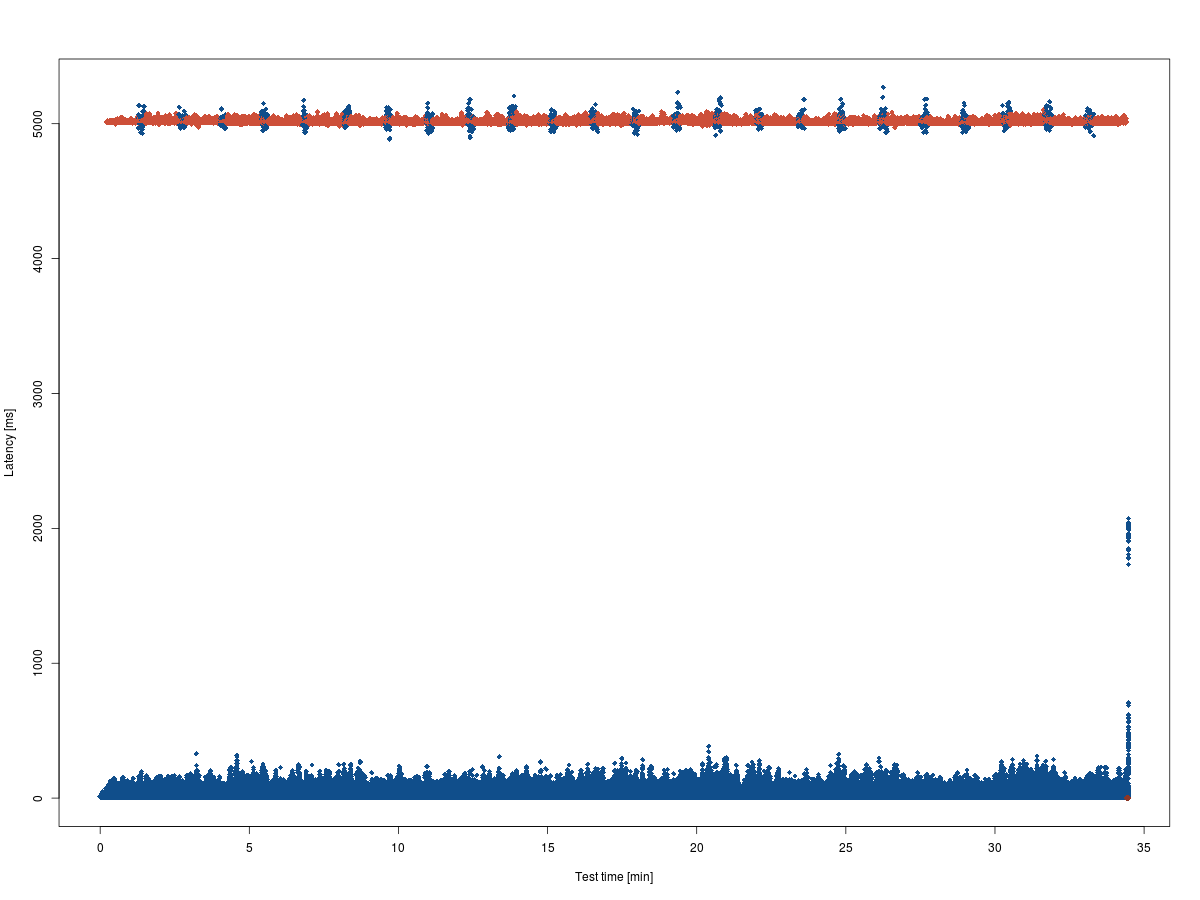
The result does not suggest any relationships between these system parameters and the response times. But that just motivates further investigation. :-) So stay tuned!
As always, the sources are available via GitHub.

References

Dienstag, 4. März 2014

Analyzing JMeter Results with R


"If you can't measure it, you can't manage it."
— Peter Drucker
To be able to improve a system's performance I need to understand the current characteristics of its operation. So I created a very simple (you might call it naïve as well) performance test with JMeter. Executing the test for roughly 35 minutes resulted in 386629 lines of raw CSV data. But raw data does not provide any insight. In order to understand what is going on I needed some statistical numbers and charts. This is where R comes into play. Reading data in is quite simple:
/response-times.R
responseTimes<-read.table("response-times.csv",header=TRUE,sep=",")
First of all, I wanted an overview of the latency over the test runtime.
/response-times.R
plot((responseTimes$timeStamp-min(responseTimes$timeStamp))/1000/60,
     responseTimes$Latency,
     xlab="Test time [min]",
     ylab="Latency [ms]",
     col="dodgerblue4",
     pch=18
)

Response times seem to be pretty stable over time, I cannot identify any trends at first sight. Nevertheless, the results are split: requests are replied to either quite fast or after about 5 seconds. The "five second barrier" is interesting, though. It is too constant to be incidental. This begs for further investigation.
As a next step, I analyzed the ratios of HTTP response codes during the test:
/response-times.R
par(lwd=4)
pie(summary(responseTimes$responseCode),
    clockwise=TRUE,
    col=c("steelblue3", "tomato2", "tomato3"),
    border=c("steelblue4","tomato4","tomato4"),
    main="HTTP Response Codes"
)

About 2/3 of the requests are handled successfully, but 1/3 of the requests resulted in server errors. That's definitely too many and needs improvements.
As a last, but very important step, I analyzed the overall service levels. So I created a plot of the cumulated relative frequency of the response times.
/response-times.R
plot(ecdf(responseTimes$Latency),
     main="Cumulative relative frequency of response times",
     xlab="Latency [ms]",
     ylab="Quantiles",
     pch=18
)
Important indicators are usability barriers and the 95 percentile. Regarding usability, the ultimate goal are 100 ms response time; this makes the system appear instantaneous. 1000 ms response time are the maximum not to interrupt the user's flow of thought.
/response-times.R
axis(1,at=c(100),labels=c("100"),col="green4")
instantResponse = cumsum(table(cut(responseTimes$Latency,c(0,100))))/nrow(responseTimes)
segments(100,-1,100,instantResponse,col="palegreen3",lty="dashed",lwd=2)
points(c(100),instantResponse,col="green4",pch=19)
text(100,instantResponse,paste(format(instantResponse*100,digits=3), "%"),col="green4",adj=c(1.1,-.3))

fastResponse = cumsum(table(cut(responseTimes$Latency,c(0,1000))))/nrow(responseTimes)
segments(1000,-1,1000,fastResponse,col="palegreen3",lty="dashed",lwd=2)
points(c(1000),fastResponse,col="green4",pch=19)
text(1000,fastResponse,paste(format(fastResponse*100,digits=3), "%"),col="green4",adj=c(1.1,-.3))
The 95 percentile is the "realistic maximum" response time. Beyond this limit are the extreme outliers that you cannot prevent on a loosely coupled, unreliable, distributed system like the internet. Fighting against these is a waste of your valuable time. But for service quality, it is important that nearly every user gets a reasonable response time. In order to calculate and plot the 95 percentile, I had to:
/response-times.R
axis(2,at=c(0,.1,.2,.3,.4,.5,.6,.7,.8,.9,.95,1),labels=FALSE)
axis(2,at=c(.95),labels=c("95%"),col="tomato3")
ninetyfiveQuantile = quantile(responseTimes$Latency,c(0.95))
segments(-10000, 0.95, ninetyfiveQuantile, .95, col="tomato1",lty="dashed",lwd=2)
points(ninetyfiveQuantile,c(0.95),col="red3",pch=19)
text(ninetyfiveQuantile,c(0.95),paste(format(ninetyfiveQuantile),"ms"),col="red3",adj=c(-.1,1.3))
These calculations result in the following plot.

To sum it up, the system is able to
  • serve 60.7 % of its users in 100 ms or less;
  • serve 63.7 % of its users in 1000 ms or less;
  • serve 95 % of its users in 5017 ms or less.
It seems very likely that the successful requests are responded quickly, and that the responses that took about 5 seconds are the 503 errors. The timeout is probably caused by some kind of bottleneck. I did not investigate this further yet, but I am quite happy with the visualizations I produced.
As always, the sources are available via GitHub.
References:

Mittwoch, 26. Februar 2014

Setting Up Zenoss for Monitoring Grails Applications


This week I spent setting up a simple monitored set of virtualized Grails application servers. As my monitoring service I chose Zenoss.

Multi-Machine Setup with Vagrant

In order to simulate a production-like private network I created a multi-machine configuration for Vagrant comprising 3 machines:
  • 10.0.0.2 is the installation target for the Zenoss server
  • 10.0.0.3 and 10.0.0.4 are the two to-be-monitored application servers, each configured as a blue/green deployable Tomcat for hosting Grails applications

Vagrantfile
VAGRANTFILE_API_VERSION = "2"

Vagrant.configure(VAGRANTFILE_API_VERSION) do |config|
  config.vm.define "zenoss" do |zenoss_server|
    zenoss_server.vm.box = "CentOS-6.2-x86_64"
    zenoss_server.vm.box_url = "https://dl.dropboxusercontent.com/u/17905319/vagrant-boxes/CentOS-6.2-x86_64.box"

    zenoss_server.vm.network :private_network, ip: "10.0.0.2"
    # ...
  end

  (1..2).each do |idx|
    config.vm.define "grails#{idx}" do |grails_web|
      grails_web.vm.box = "squeezy"
      grails_web.vm.box_url = "https://dl.dropboxusercontent.com/u/17905319/vagrant-boxes/squeezy.box"

      grails_web.vm.network :private_network, ip: "10.0.0.#{2 + idx}"
      # ...
    end
  end
end

Installing the Zenoss server

All the machines are provisioned with Chef. For the server, there is a dedicated role in roles/zenoss_server.rb. Besides filling the run list with the zenoss::server recipe, it configures various attributes for Java and the Zenoss installation.
Vagrantfile
  config.vm.define "zenoss" do |zenoss_server|
    # ...
    zenoss_server.vm.provision :chef_solo do |chef|
      # ...
      chef.add_role "zenoss_server"
      # ...

      chef.json = {
        domain: "localhost"
      }
    end
  end
roles/zenoss_server.rb
name "zenoss_server"
description "Configures the Zenoss monitoring server"

default_attributes(
  "zenoss" => {
    "device" => {
      "properties" => {
        "zCommandUsername" => "zenoss",
        "zKeyPath" => "/home/zenoss/.ssh/id_dsa",
        "zMySqlPassword" => "zenoss",
        "zMySqlUsername" => "zenoss"
      }
    }
  }
)

override_attributes(
  "java" => {
    "install_flavor" => "oracle",
    "jdk_version" => "7",
    "oracle" => {
      "accept_oracle_download_terms" => true
    }
  },
  "zenoss" => {
    "server" => {
      "admin_password" => "zenoss"
    },
    "core4" => {
      "rpm_url" => "http://downloads.sourceforge.net/project/zenoss/zenoss-4.2/zenoss-4.2.4/4.2.4-1897/zenoss_core-4.2.4-1897.el6.x86_64.rpm?r=http%3A%2F%2Fsourceforge.net%2Fprojects%2Fzenoss%2Ffiles%2Fzenoss-4.2%2Fzenoss-4.2.4%2F4.2.4-1897%2F&ts=1392587207&use_mirror=skylink"
    },
    "device" => {
      "device_class" => "/Server/SSH/Linux"
    }
  }
)

run_list(
  "recipe[zenoss::server]"
)

Installing the Application Servers

In order to prepare an application server for monitoring, you have to install the SNMP daemon. The Simple Network Management Protocol provides insights into various system parameters like CPU utilization, disk usage, RAM statistics. I bundled my common run list and attributes in roles/monitored.rb
Vagrantfile
  (1..2).each do |idx|
    config.vm.define "grails#{idx}" do |grails_web|
      # ...
      grails_web.vm.provision :chef_solo do |chef|
        # ...
        chef.add_role   "monitored"

        chef.json = {
          domain: "localhost",
        }
      end
    end
  end
roles/monitored.rb
name "monitored"
description "Bundles settings for nodes monitored by Zenoss"

default_attributes()

override_attributes(
  "snmp" => {
    "snmpd" => {
      "snmpd_opts" => '-Lsd -Lf /dev/null -u snmp -g snmp -I -smux -p /var/run/snmpd.pid'
    },
    "full_systemview" => true,
    "include_all_disks" => true
  }
)

run_list(
  "recipe[snmp]"
)

Signing up the Application Servers for Monitoring

Now we must acquaint the Application Servers with Zenoss. As a first step, I did this manually via the Zenoss Web UI. The Web UI is only reachable through the server's loopback interface. To make it accessible from my browser, I tunneled HTTP traffic to the loopback device via SSH:
Terminal
ssh -p 2222 -o "UserKnownHostsFile /dev/null" -o "StrictHostKeyChecking no" -N -L 8080:127.0.0.1:8080 root@localhost
# Password is `vagrant'
Now I can access the UI from localhost:8080.

Logging in with the credentials from roles/zenoss_server.rb, we can access the dashboard:

Switching over to the Infrastructure tab, we can Add Multiple Devices:

We input the IP addresses of our two virtual app servers, 10.0.0.3 and 10.0.0.4, and keep the default value for the device type, Linux Server (SNMP).

Now, Zenoss adds these two nodes to its server pool in the background:

Having finished this, Zenoss starts recording events and measurements of the nodes. This is an example from a simple load scenario of a Grails application on node grails2, 10.0.0.4

Now you are prepared for further exploration of the server performance jungle. All my sources are available from GitHub.

Dienstag, 11. Februar 2014

Zero-Downtime Deployment for Grails Applications

Often, it's okay to have a (short) downtime when deploying a new version of your application. But my recent customer is into a time-critical round-the-clock business. Downtime is very critical, there is only a short window of time for deployment, once a day. In this context, continuous deployment is not an option, which limits the level of support and the possibilities for feedback.

The solution is Blue/Green Deployment. One deploys a new version to an offline service and moves the incoming traffic from the old version to the new one once it's deployed. I adapted a solution from Jakub Holy.
There are several options to deploy different version of an application in parallel to Tomcat. I want to discuss them shortly:

Different context roots

Deploying to different context roots within the same Tomcat container, e.g. localhost:8080/version1, localhost:8080/version2 etc.

Pros

  • No changes to the Tomcat installation or configuration

Cons

  • Requires URL rewriting by the reverse proxy which is harder to configure.
  • Very likely, due to memory leaks, the Tomcat instance will run out of memory (PermGen), and there is no possibility to restart the instance without downtime.

Different Tomcat listeners

One can start multiple listeners within the same container, providing the applications on different ports, e.g. localhost:8080/ and localhost:8081

Pros

  • No changes to the Tomcat installation (startup scripts, default environment variables and paths).

Cons

  • Some changes to the Tomcat config file, server.xml, necessary.
  • Very likely, due to memory leaks, the Tomcat instance will run out of memory (PermGen), and there is no possibility to restart the instance without downtime.

Different Tomcat instances

Last, but definitely not least, there is the "big" solution; start two completely separate Tomcat instances.

Pros

  • It is possible to restart the offline Tomcat instance without any downtime.
  • This enables repeated deployments without running out of memory at some time.

Cons

  • Requires very many changes to the system configuration, because every configuration artifact must be available twice. You need two startup scripts, two Catalina home directories, two server.xml, context.xml, two logging directories and so on.
Being the only option that allows real zero-downtime operations, I chose the latter option.

    Session-Handling

    The last problem to tackle is the session handling. By default, the session information like logins is limited to one application instance. If every deployment requires the users to login again, zero-downtime will result in zero-acceptance, too. The solution to this problem is clustering the two Tomcat instances.
    This requires a few changes to the application itself. The application must be marked as 'distributable'. The simplest way to achieve this is creating a deployment descriptor in src/templates/war/web.xml:
    <web-app ...>
      <display-name>/@grails.project.key@</display-name>
     
      <!-- Add this line -->
      <distributable />
      ...
    </web-app>
    Besides, clustering must be activated in Tomcat's server.xml:
    <Server port="8005" shutdown="SHUTDOWN">
      <!-- ... -->
      <Service name="Catalina">
        <!-- ... -->
        <Engine name="Catalina" defaultHost="localhost">

          <Cluster className="org.apache.catalina.ha.tcp.SimpleTcpCluster"
                   channelSendOptions="8">

            <Manager className="org.apache.catalina.ha.session.DeltaManager"
                     expireSessionsOnShutdown="false"
                     notifyListenersOnReplication="true"/>

            <Channel className="org.apache.catalina.tribes.group.GroupChannel">
              <Membership className="org.apache.catalina.tribes.membership.McastService"
                          address="228.0.0.4"
                          port="45564"
                          frequency="500"
                          dropTime="3000"/>
              <Receiver className="org.apache.catalina.tribes.transport.nio.NioReceiver"
                        address="auto"
                        port="4000"
                        autoBind="100"
                        selectorTimeout="5000"
                        maxThreads="6"/>

              <Sender className="org.apache.catalina.tribes.transport.ReplicationTransmitter">
                <Transport className="org.apache.catalina.tribes.transport.nio.PooledParallelSender"/>
              </Sender>

              <Interceptor className="org.apache.catalina.tribes.group.interceptors.TcpFailureDetector"/>
              <Interceptor className="org.apache.catalina.tribes.group.interceptors.MessageDispatch15Interceptor"/>
              <Interceptor className="org.apache.catalina.tribes.group.interceptors.ThroughputInterceptor"/>
            </Channel>

            <Valve className="org.apache.catalina.ha.tcp.ReplicationValve" filter=""/>
            <Valve className="org.apache.catalina.ha.session.JvmRouteBinderValve"/>

            <ClusterListener className="org.apache.catalina.ha.session.JvmRouteSessionIDBinderListener"/>
            <ClusterListener className="org.apache.catalina.ha.session.ClusterSessionListener"/>
          </Cluster>

        </Engine>
      </Service>
    </Server>
    This configuration enables session replication using TCP multicasting. There are alternatives where session information is persisted to disk which would enable failover and recovery from crashes. But for my scenario—just two Tomcat instances on the same machine—direct TCP synchronization seems sufficient.

    Moving from Blue to Green

    Finally, incoming requests have to be routed to the active Tomcat instance. In my setup, that's the duty of haproxy. As described in the documentation, one can configure haproxy to forward incoming requests to either of several backends.
    To simplify the process of deployment and reconfiguration of haproxy, I developed a little Bash script:
    #!/bin/bash
    if [ $# -ne 1 ]; then
      echo "Usage: $0 <war-file>"
      exit 1
    fi

    set -e
    retry=60
    war_file=$1

    current_link=`readlink /etc/haproxy/haproxy.cfg`
    if [ $current_link = "./haproxy.green.cfg" ]; then
      current_environment="GREEN"
      target_environment="BLUE"
      target_service="tomcat6-blue"
      target_port="8080"
      target_webapps="/var/lib/tomcat6-blue/webapps"
      target_config_file="./haproxy.blue.cfg"
    fi
    if [ $current_link = "./haproxy.blue.cfg" ]; then
      current_environment="BLUE"
      target_environment="GREEN"
      target_service="tomcat6-green"
      target_port="8081"
      target_webapps="/var/lib/tomcat6-green/webapps"
      target_config_file="./haproxy.green.cfg"
    fi
    echo "haproxy is connected to $current_environment backend"

    curl --user deployer:supersecret http://localhost:$target_port/manager/undeploy?path=/
    service $target_service stop

    cp --verbose $war_file $target_webapps/ROOT.war
    service $target_service start
    until curl --head --fail --max-time 10 http://localhost:$target_port/; do
        if [ $retry -le 0 ]; then
          echo "$war_file was not deployed successfully within retry limit"
          exit 1
        fi
        echo "Waiting 5 secs for successful deployment"
        sleep 5
        echo "$((--retry)) attempts remaining"
    done
    ln --symbolic --force --no-target-directory --verbose $target_config_file /etc/haproxy/haproxy.cfg
    service haproxy reload
     

    Putting everything together

    Finally, I collected all of the configuration, scripts, and so on into a Chef cookbook, forked from the original Tomcat cookbook. I provide a GitHub repository that helps you setup a virtual machine with Vagrant and the described Tomcat / haproxy configuration.
    git clone https://github.com/andreassimon/zero-downtime.git
    cd zero-downtime
    bundle install
    librarian-chef install
    vagrant up
    Copy your WAR file into the project directory, and deploy it to the virtual machine:
    cp /home/foo/your-war-file.war .
    vagrant ssh
    sudo -i
    deploy-war /vagrant/your-war-file.war
    Now, you can access the virtual machine in your host browser via http://localhost:8080/.